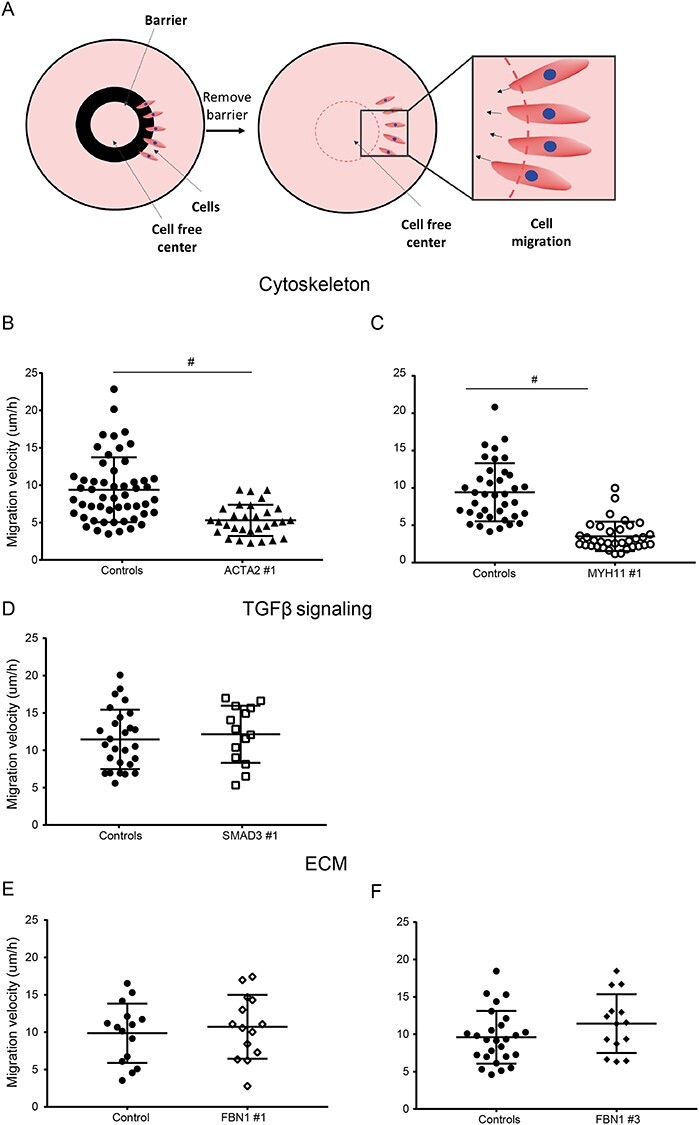
Figure 4 .

Migration potential of control and VSMC-like cells of patients with a pathogenic mutation. (A) Schematic representation of the ring barrier assay to measure migration. Cells are seeded on coverslips in the outside area of the wall. A ring is blocking the migration of the cells, preserving a cell-free are in the center. Once the ring is removed, cells start to migrate towards the center and the migration velocity is quantified. (B–F) Migration velocity of pathogenic variant VSMC-like cells compared with controls. (A) ACTA2, (B) MYH11, (C) SMAD3, (D) FBN1 #1 and (E) FBN1 #3 VSMC-like cells, n = 2, #P = <0.001. Data are presented as boxplots with mean ± 2SD; red dotted line indicates mean value of the control cells, black dotted lines indicate ±2SD.
