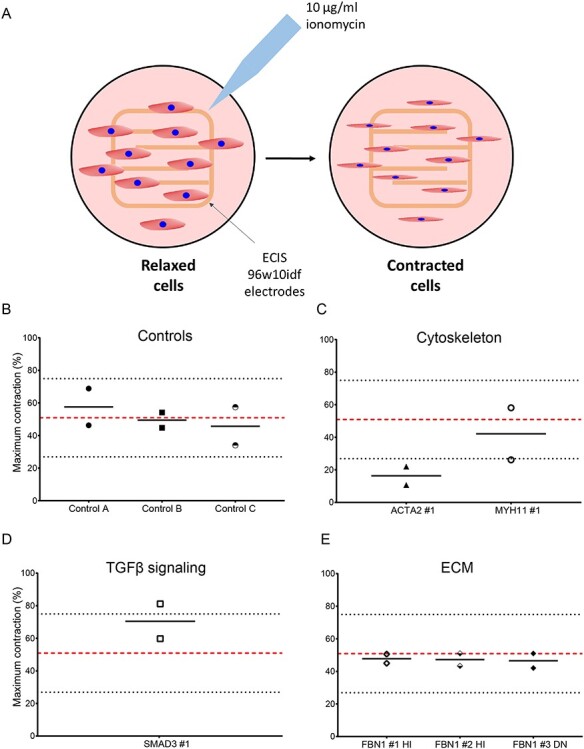
Figure 5 .

Maximum contraction of control and VSMC-like cells of patients with a pathogenic mutation. (A) Schematic representation of measuring VSMC-like cell contractility using ECIS. Cells are seeded on electrodes which record the baseline resistance of relaxed cells as a function of their surface. Upon ionomycin stimulation, cells contract, which reduces their surface and subsequently resistance. (A) Maximum contraction of controls VSMC-like cells. (B) Maximum contraction of ACTA2 and MYH11 variant VSMC-like cells. (C) Maximum contraction of SMAD3 variant VSMC-like cells. (D) Maximum contraction of FBN1 variant VSMC-like cells, n = 2. Data are presented as boxplots with mean ± 2SD; red dotted line indicates mean value of the control cells, black dotted lines indicate ±2SD.
