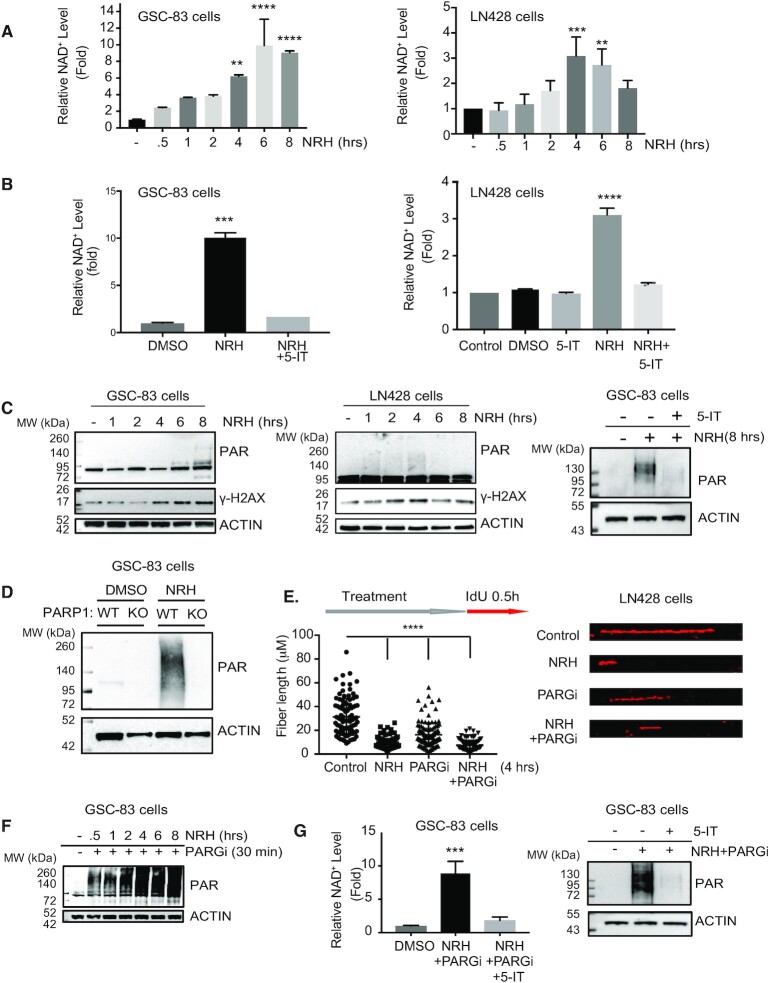
Figure 2.
Dihydronicotinamide riboside (NRH) increases cellular NAD+ levels and promotes spontaneous PAR formation to suppress replication in GSCs and glioma cells. (A) Total cellular NAD+ levels in GSC-83 cells (left panel) or LN428 glioma cells (right panel) after treatment with NRH (100 μM) for the time periods indicated, normalized to the NAD+ level of cells treated with DMSO; **P < 0.01, ***P < 0.001,****P < 0.0001, related to control. (B) Total cellular NAD+ levels in GSC-83 cells (left panel) or LN428 glioma cells (right panel) after treatment with NRH (100 μM), the adenosine kinase inhibitor, 5-Iodotubercidin (5-IT) or NRH+5-IT for 4 h, normalized to the NAD+ level in cells treated with DMSO; ***P < 0.001,****P < 0.0001, related to control. (C) PAR (poly-ADP-ribose) and γ-H2AX immunoblot analysis of total cell lysates (GSC-83 cells, left panel; LN428 cells, middle panel) after treatment with NRH (100 μM) for the times indicated, as compared to cells treated with DMSO. PAR immunoblot analysis of total cell lysates (GSC-83 cells) after treatment with DMSO, NRH (100 μM) or NRH + 5-IT (right panel). For all, β-Actin was used as the loading control. (D) PAR (poly-ADP-ribose) immunoblot analysis of total cell lysates (GSC-83/WT or GSC-83/PARP1-KO cells, as indicated) after treatment with NRH (100 μM) for 4 h, as compared to cells treated with DMSO. β-Actin was used as the loading control. (E) DNA fiber analysis as a measure of replication (indicated as DNA fiber length) in LN428 cells following treatment with NRH (100 μM), PARGi (10 μM) or NRH plus PARGi for 4 h as compared to untreated cells (control). After 4 h of treatment with NRH, IdU (25 μM) was added to the media for 30 min. Following cell lysis, naked DNA was combed on coverslips followed by immunostaining of DNA fibers that were labeled with IdU. Coverslips were imaged by confocal microscopy and DNA fiber length was measured and plotted (left panel). A representative DNA fiber image of each treatment is shown (right panel) (****P < 0.0001). (F) PAR immunoblot analysis from total cell lysates (GSC-83 cells) after treatment with NRH (100 μM) + PARGi (10 μM) for the times indicated. β-Actin was used as the loading control. (G) Total cellular NAD+ levels in GSC-83 cells (left panel) after treatment with NRH (100 μM) +PARGi (10 μM) or NRH+PARGi+5-IT, normalized to the NAD+ level of cells treated with DMSO; ***P < 0.001. PAR immunoblot analysis (right panel) from total cell lysates (GSC-83 cells) after treatment with NRH+PARGi or NRH+PARGi+5-IT (right panel). β-Actin was used as the loading control.

