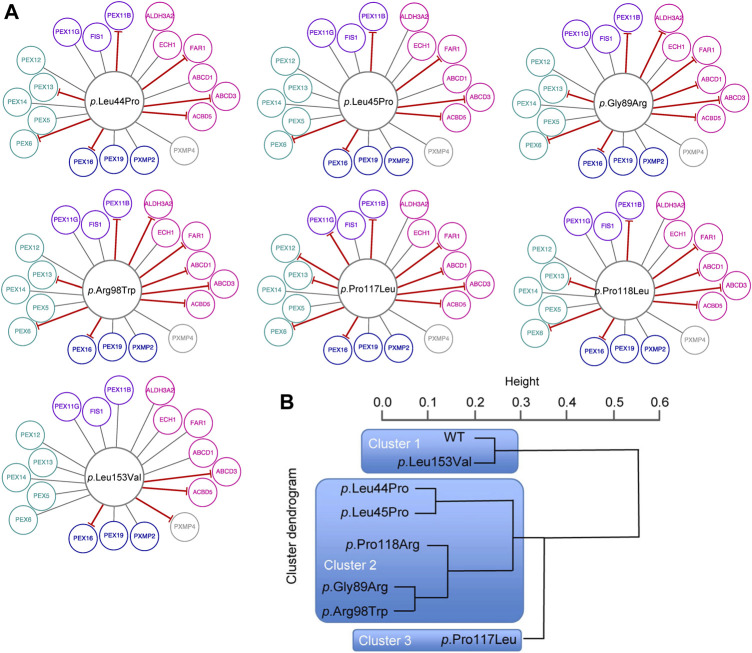
FIGURE 4.
Edgetic perturbations due to missense variants in PEX26. (A) Variant specific PEX26 networks vary with respect to number and pattern of edgetic perturbations. Interacting proteins are grouped with respect to peroxisomal function (fatty acid metabolism, pink; membrane assembly, dark blue; matrix protein import, cyan; division and proliferation, violet; unknown function, grey). Disrupted interactions are depicted by a red T-arrowed edge. (B) Hierarchical cluster analysis defined subgroups of missense variants using a distance matrix algorithm. The height of the dendrogram reflects the relation of individual clusters. Three main clusters are highlighted by blue boxes.

