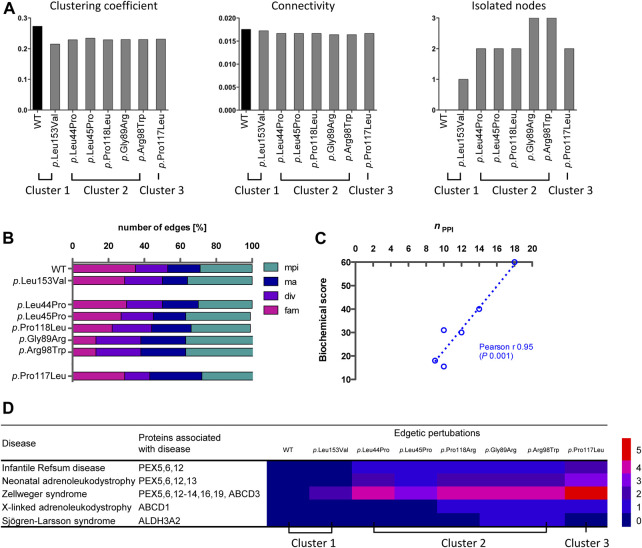
FIGURE 5.
Analyses of variant-specific PEX26 networks and correlation to phenotypic parameters. (A) Clustering coefficient, connectivity and isolated note analysis of the WT and variant PEX26 network comprising all nodes directly or indirectly connected to WT or variant PEX26, respectively, by edges. (B) Impact of edgetic perturbations due to missense variants in PEX26 on building-blocks of peroxisomal function (mpi, matrix protein import; ma, membrane assembly; div, division and proliferation; fam, fatty acid metabolism). The total number of remaining edges for each variant was set to 100%. Variants are grouped according to previously identified clusters. (C) Correlation analysis between the number of maintained interactions (n PPI) and a literature based biochemical score reflecting the import of peroxisomal matrix proteins (catalase, PTS1, PTS2) and protein stability. The relationship of the correlating variables was linear, as depicted by the dashed line. (D) Association of edgetic perturbations and clinical disease entities of the respective PEX26 binding partners. The heatmap highlights the number of edgetic perturbations of the PEX26 variants to proteins associated with different disease related peroxisomal dysfunctions.

