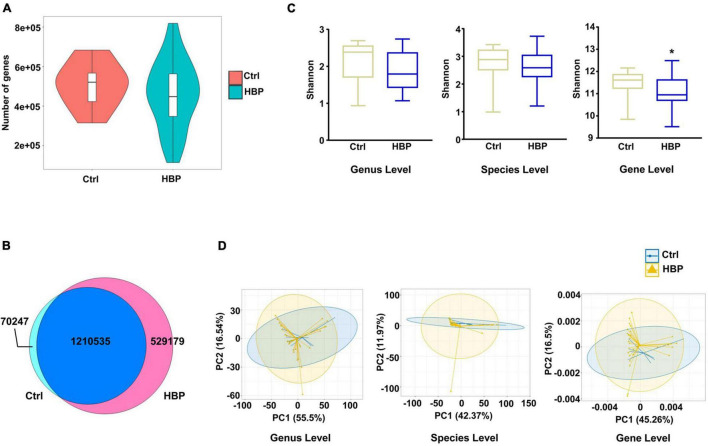
FIGURE 1.
Microbial diversity shows slight difference between healthy control and primary hypertension patients with antihypertension medications. (A) Gene count comparison between the two groups. (B) Venn comparison of the shared gene numbers and unique gene numbers between the two groups. (C) α-Diversity analysis (Shannon index) based on genus, species, and ortholog profile in the two groups. (D) Principal component analysis (PCA) of β-diversity analysis based on genus, species, and orthologs profile between the two groups. Ctrl, healthy control group, n = 8. HBP, primary hypertension patient group who took antihypertension medications before testing metagenomics, n = 30. Gene level, i.e., ortholog level. *p < 0.05 by one-tailed Mann–Whitney U-test.

