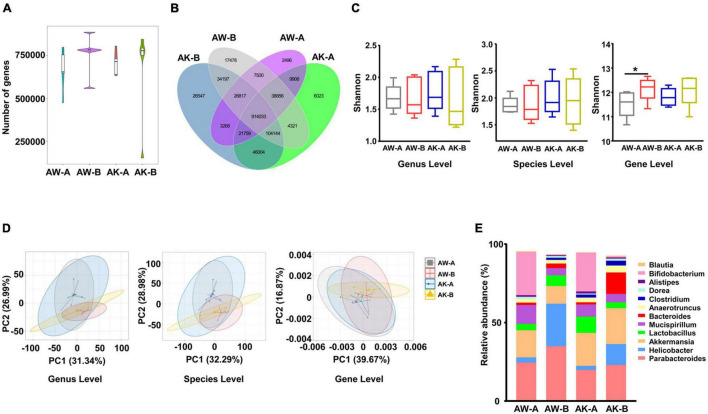
FIGURE 4.
Microbial composition changes among wild-type and adenosine monophosphate-activated protein kinase (AMPK)-knockout mice before and after angiotensin II treatment. (A) Gene count comparison among the four groups. (B) Venn comparison of the shared gene numbers and unique gene numbers among the four groups. (C) α-Diversity analysis (Shannon index) based on genus, species, and ortholog profile in the four groups. (D) Principal component analysis (PCA) of β-diversity analysis based on genus, species, and ortholog profile among the four groups. (E) The relative abundances of the top 12 highest abundant genera among the four groups. AW-A, wild-type mice (AMPKα1fl/fl/WT, already received tamoxifen injection), which did not receive angiotensin II treatment. AW-B, wild-type mice received angiotensin II stimulation for 7 days. AK-A, AMPK-knockout mice (AMPKα1fl/fl/Csf1r-MerCre, already received tamoxifen injection), which did not receive angiotensin II treatment. AK-B, AMPK-knockout mice received angiotensin II stimulation for 7 days. Gene level, i.e., ortholog level. *p < 0.05 by one-tailed Mann–Whitney U-test.

