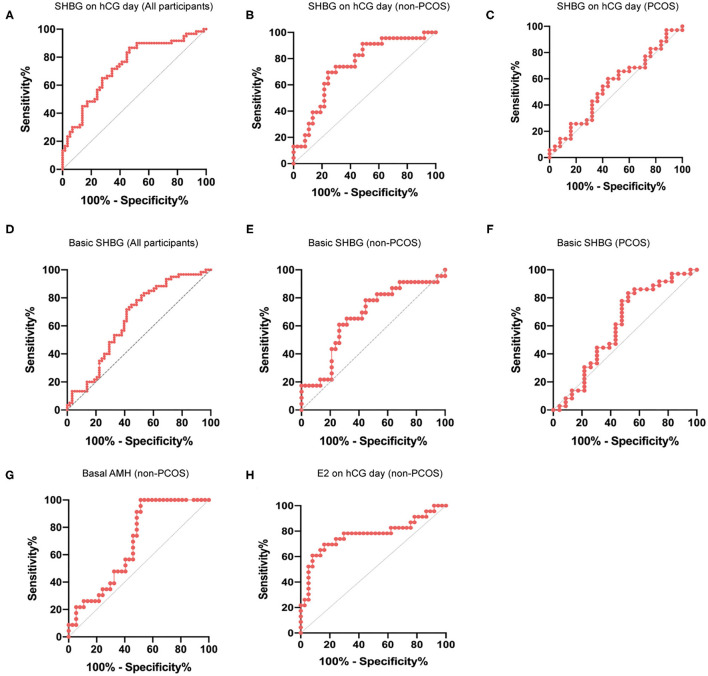
Figure 3.
ROC curve for prediction of ovarian response using hCG-day SHBG. (A) ROC curve for prediction of ovarian response (normal response and high response) with hCG-day SHBG in the total cohort (n = 120); P < 0.0001. (B) ROC curve for predicting ovarian response (normal response and high response) with hCG-day SHBG in non-PCOS participants (n = 60); P = 0.0015. (C) ROC curve for predicting ovarian response (normal response and high response) with hCG-day SHBG in PCOS participants (n = 60); P = 0.5142. (D) ROC curve for prediction of ovarian response (normal response and high response) with basic SHBG in the total cohort (n = 120); P = 0.0028. (E) ROC curve for predicting ovarian response (normal response and high response) with basic SHBG in non-PCOS participants (n = 60); P = 0.0287. (F) ROC curve for predicting ovarian response (normal response and high response) with basic SHBG in PCOS participants (n = 60); P = 0.1982. (G) ROC curve for predicting ovarian response (normal response and high response) with basal AMH in non-PCOS participants (n = 60); P = 0.018. (H) ROC curve for predicting ovarian response (normal response and high response) with hCG-day E2 in non-PCOS participants (n = 60); P = 0.0005.

