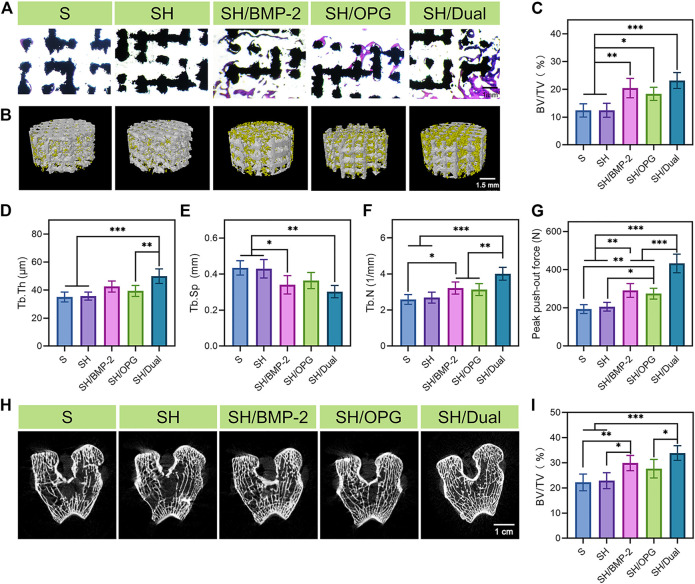
FIGURE 4.
Bone regeneration and osseointegration in the 3D-printed composite scaffolds. (A) Masson’s trichrome staining of the regenerated bone tissue in and around the 3D-printed composite scaffolds. (B) 3D reconstruction images of different groups (the yellow substance represents the new bone tissue). (C–F) Micro-CT analyses of BV/TV, Tb.Th, Tb.Sp, and Tb.N in each group. (G) The analysis of the push-out test. (H) The CT images of the distal end of the implants in each group. (I) Quantitative analysis of the 2-cm-long femur at the distal end in each group. * indicates significant difference between groups, *p < 0.05, **p < 0.01, and ***p < 0.001. BV/TV, bone volume/tissue volume ratio; Tb.Th, trabecular thickness; Tb.Sp, trabecular separation; Tb.N, trabecular number.

