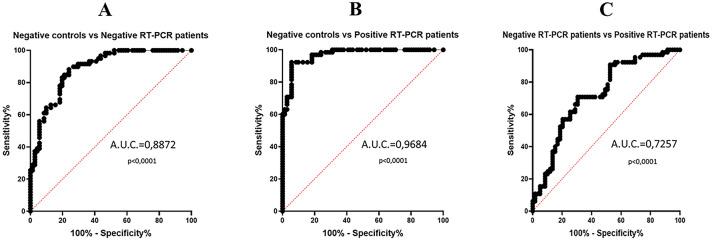
Fig. 3.
Plasma calprotectin ROC curves. A The comparison between healthy negative control group and negative SARS-CoV-2 RT-PCR patient group (AUC = 0.8872, p < 0.0001); B the comparison between healthy negative control group and positive SARS-CoV-2 RT-PCR patient group (AUC = 0.9684, p < 0.0001); C the comparison between negative SARS-CoV-2 RT-PCR patient group and positive SARS-CoV-2 RT-PCR patient group (AUC = 0.7257, p < 0.0001)

