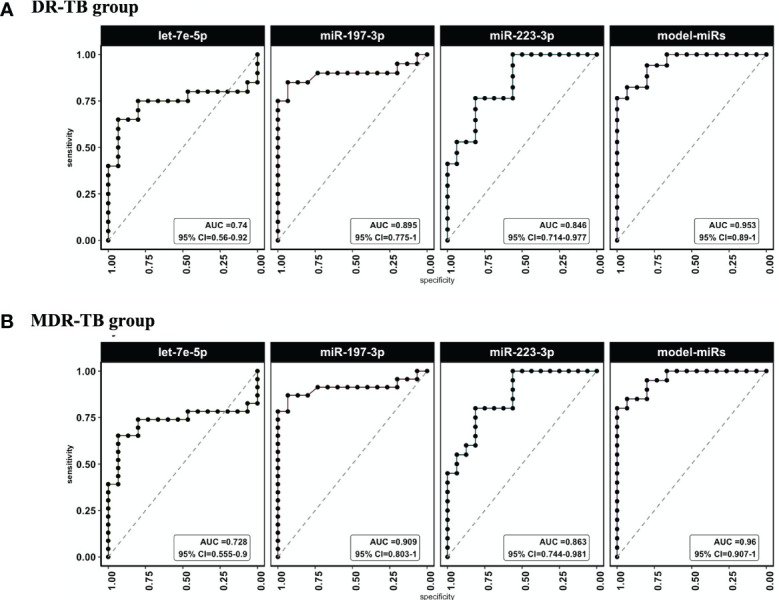
Figure 3.

ROC curves and AUC values for miRlet-7e-5p, -197-3p and -223-3p miRNAs in TB patients vs healthy subjects. ROC analysis was done to evaluate sensitivity and specificity. ROC curves were used to compare the relative expression of the three miRNAs in DR-TB and MDR-TB patients with those expressed in healthy subjects. (A) AUC and CI to miR-let-7e-5p, -197-3p and -223-3p for DR-TB patients and (B) (AUC) and CI to miR-let-7e-5p, -197-3p and -223-3p for MDR-TB patients. AUC, area under the curve; CI, confidence interval; ROC, receiver operator characteristic. Only statistical differences with p < 0.05 are shown.
