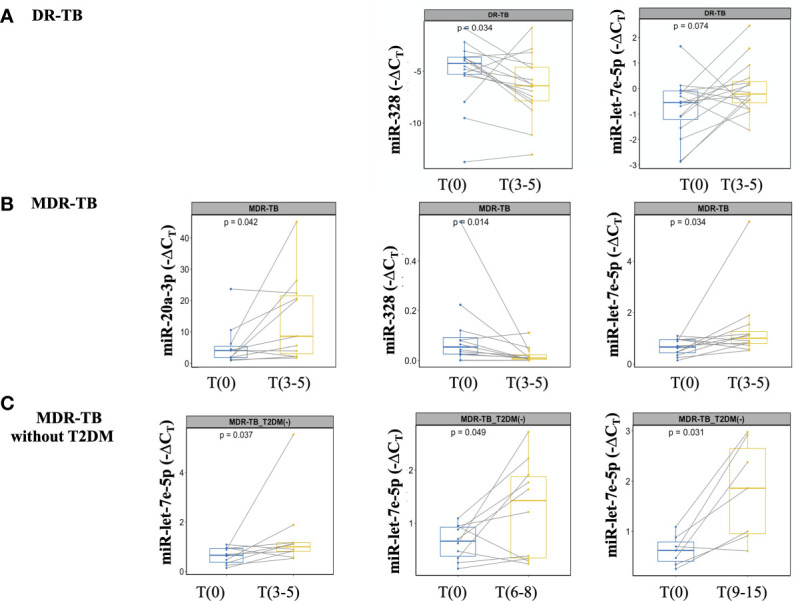
Figure 4.

miRNAs detection at the time of M. tuberculosis negative culture from DR-TB patients and treatment monitoring from MDR-TB without T2DM. miRNAs expression analyzed at T(0) and T(3-5). The data are expressed as ΔCT, box plots depict medians and quartiles. Lines show the expression change for each patient. (A) DR-TB patients, (B) MDR-TB patients, and (C) MDR-TB without T2DM. Wilcoxon signed-rank test T(0) vs. T(3-5) or T(6-8) or T(9-15). Only statistical differences with p < 0.05 are shown.
