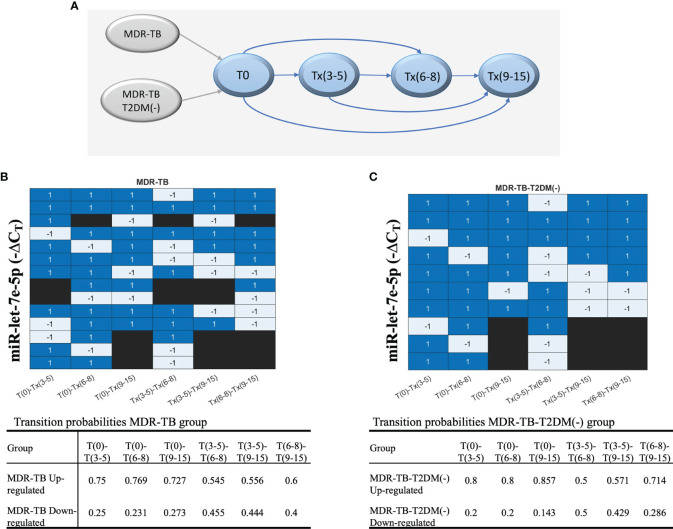
Figure 5.
The behavior of each group of patients, showing the evolution of each patient according to the ΔCT values during the periods of time. (A) The transitions model comparing six times. Upregulation or downregulation in the ΔCT value between time points is illustrated in a heatmap. Blue: upregulation in the ΔCT value in the next time point or the target time point; gray: downregulation in the ΔCT Cs value, and black: no transition between time points. (B) MDR-TB group and (C) MDR-TB-T2DM (-) group. The table includes results of the transition probabilities of the two groups: MDR-TB, MDR-TB-T2DM(-). Each group is divided at the same time point into 2 subgroups according to the ΔCT values of transition: upregulated or downregulated.

