. 2021 Nov 4;8:771078. doi: 10.3389/fnut.2021.771078

Table 2.

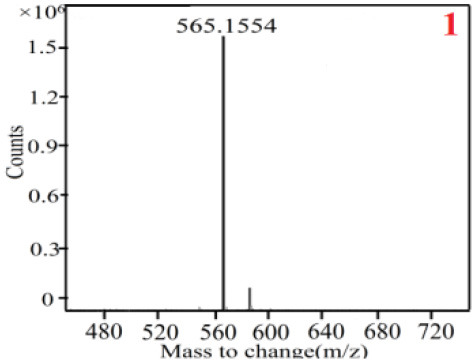
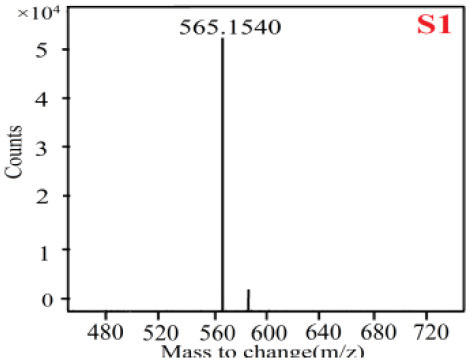
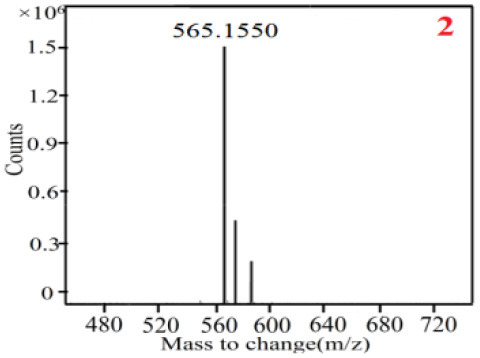
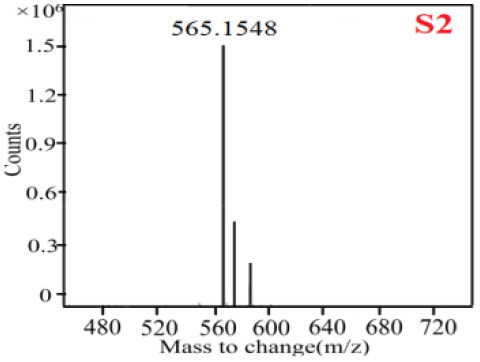
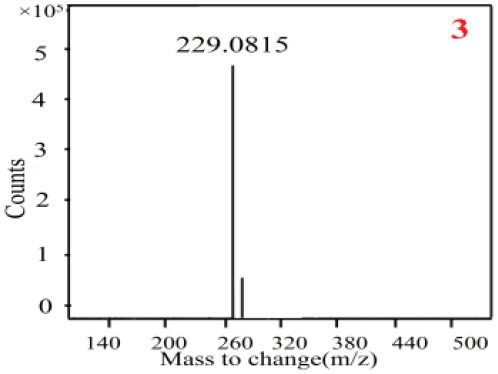
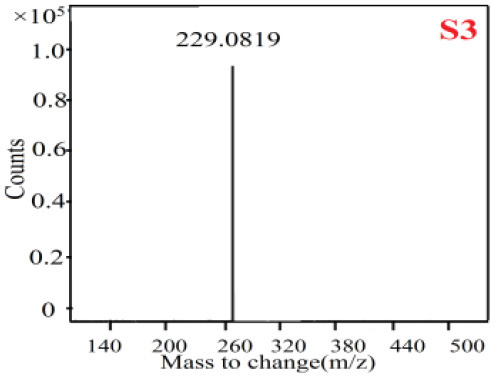
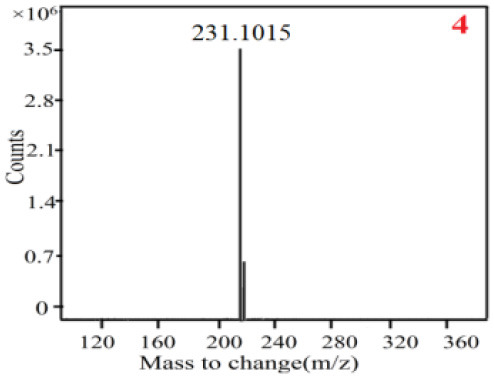
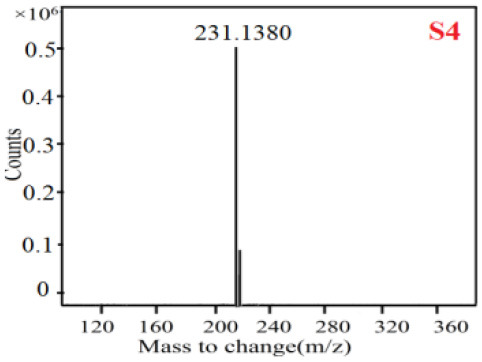
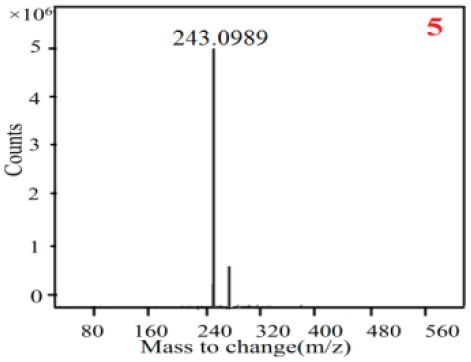
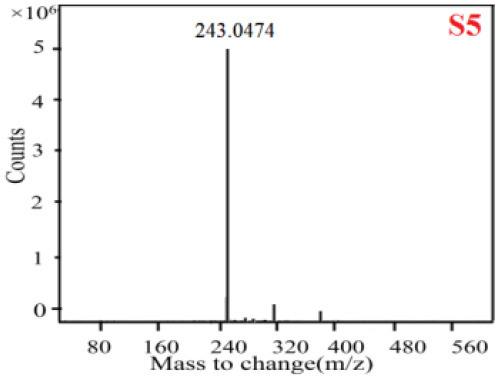
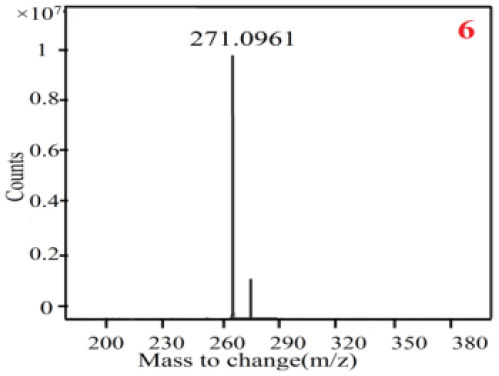
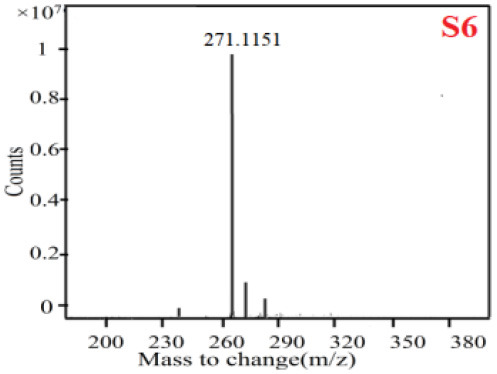
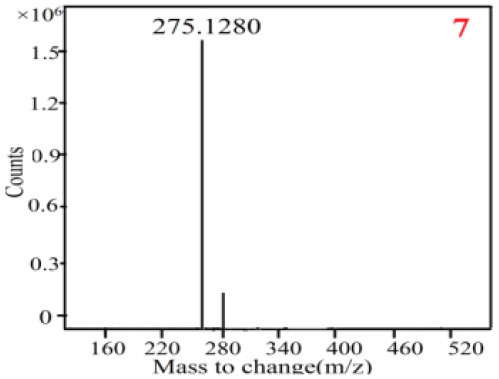
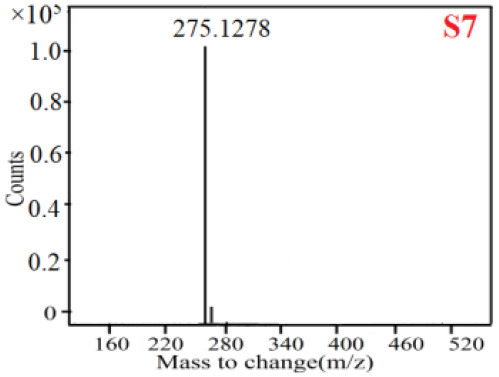
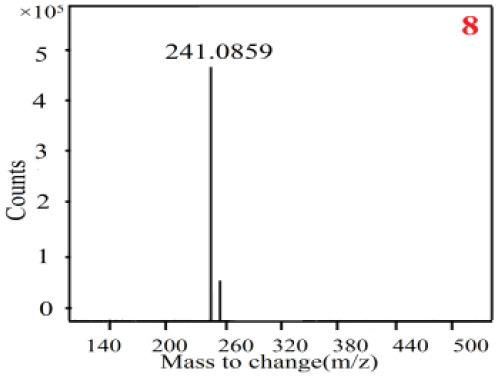
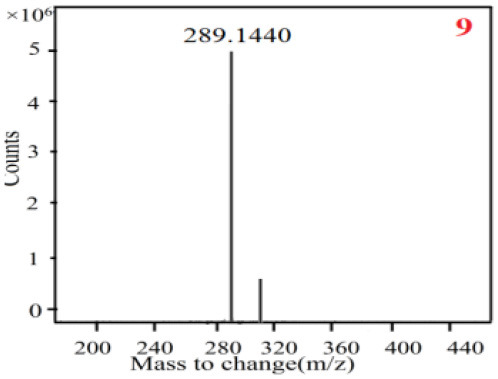
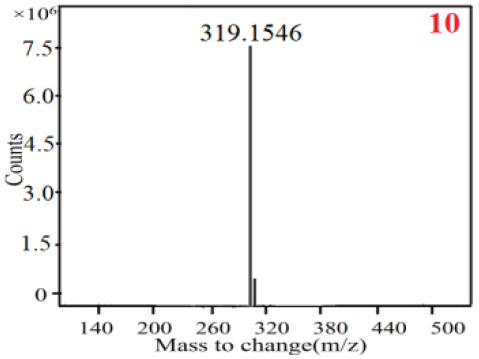
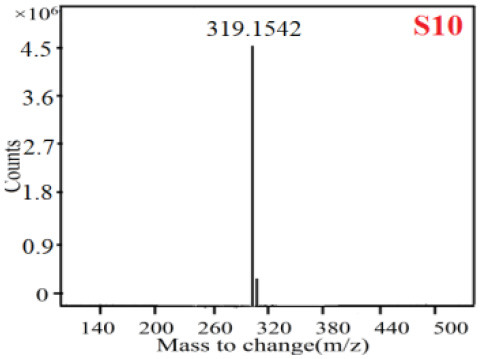
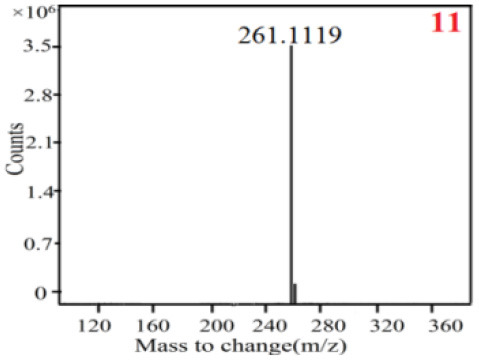
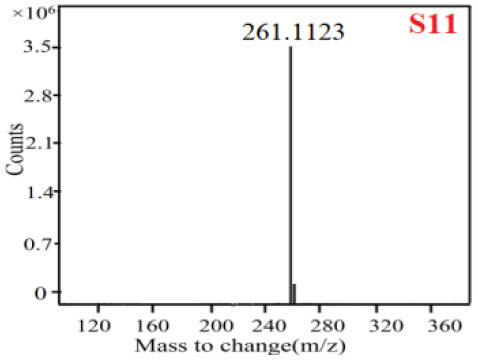
The MS spectrum of the standards and the possible polyphenols obtained by Q-TOF-MS analysis.

Standards Possible polyphenol in the samples
Compound MS MS
1 graphic file with name fnut-08-771078-i0023.jpg graphic file with name fnut-08-771078-i0024.jpg
2 graphic file with name fnut-08-771078-i0025.jpg graphic file with name fnut-08-771078-i0026.jpg
3 graphic file with name fnut-08-771078-i0027.jpg graphic file with name fnut-08-771078-i0028.jpg
4 graphic file with name fnut-08-771078-i0029.jpg graphic file with name fnut-08-771078-i0030.jpg
5 graphic file with name fnut-08-771078-i0031.jpg graphic file with name fnut-08-771078-i0032.jpg
6 graphic file with name fnut-08-771078-i0033.jpg graphic file with name fnut-08-771078-i0034.jpg
7 graphic file with name fnut-08-771078-i0035.jpg graphic file with name fnut-08-771078-i0036.jpg
8 graphic file with name fnut-08-771078-i0037.jpg
9 graphic file with name fnut-08-771078-i0038.jpg
10 graphic file with name fnut-08-771078-i0039.jpg graphic file with name fnut-08-771078-i0040.jpg
11 graphic file with name fnut-08-771078-i0041.jpg graphic file with name fnut-08-771078-i0042.jpg

The numbers 1–11 represent the standard compounds 1–11 in Figure 1.