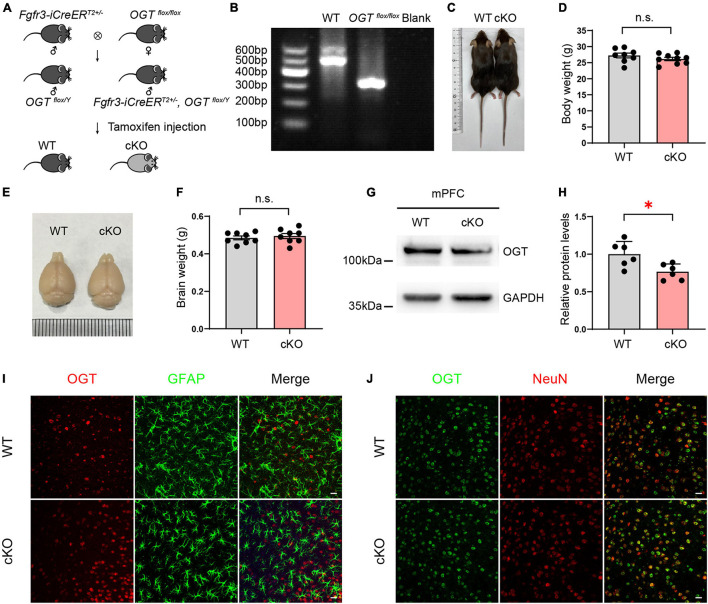
FIGURE 1.
Generation of astrocyte-specific OGT conditional knockout mice. (A) Generation of OGT cKO mice by crossing OGTflox/flox lines with Fgfr3-iCreERT2 lines. (B) Genotyping of OGTflox/flox mice and littermate wide-type mice. (C,D) The represented image (C) and quantification of body weight changes after TAM injection (D) for cKO and littermate controls. n = 8 (WT), 9 (cKO). (E,F) Representative image (E) and the quantification of brain weight change (F) after TAM injection. n = 8 (WT), 8 (cKO). (G,H) Western blot images (G) and quantification (H) of OGT levels in the mPFC of cKO and WT mice. n = 6 (WT), 6 (cKO). (I) Double immunofluorescence staining of OGT (red) with GFAP (green) in cKO and WT mice. Scale bar = 20 μm. (J) Double immunofluorescence staining of OGT (green) with NeuN (red) in cKO and WT mice. Scale bar = 20 μm. All data are presented the mean ± SEM. Two-sided unpaired t-test, ∗P < 0.05; n.s, no significance.

