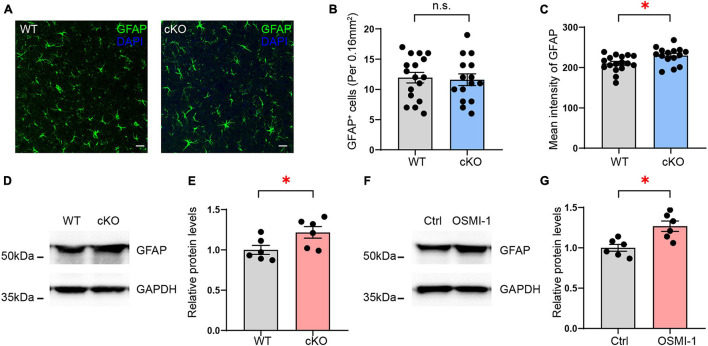
FIGURE 9.
Validation of GFAP expression regulated by OGT in astrocytes. (A) Immunofluorescence staining of GFAP (green) in astrocyte-specific OGT conditional knockout mice and WT mice. Scale bar = 20 μm. (B) Quantification of GFAP positive cells in the mPFC of cKO and WT mice. n = 17 (WT), 15 (cKO). (C) Quantification of mean fluorescence intensity in the mPFC of cKO and WT mice. n = 17 (WT), 15 (cKO). (D,E) Western blot images (D) and quantification (E) of GFAP expression in the mPFC of astrocyte-specific OGT conditional knockout mice and controls. The blots were cropped according to their molecular weight. Tissue levels of GAPDH were used as loading controls. Protein expression was normalized to the control levels. n = 6 (WT), 6 (cKO). (F,G) Western blot images (F) and quantification (G) of GFAP levels in primary cultured astrocytes treated with OGT inhibitor (OSMI-1) and controls. n = 6 (Control), 6 (OSMI-1). Two-sided unpaired t-test. ∗P < 0.05; n.s: no significance.

