Figure 3.
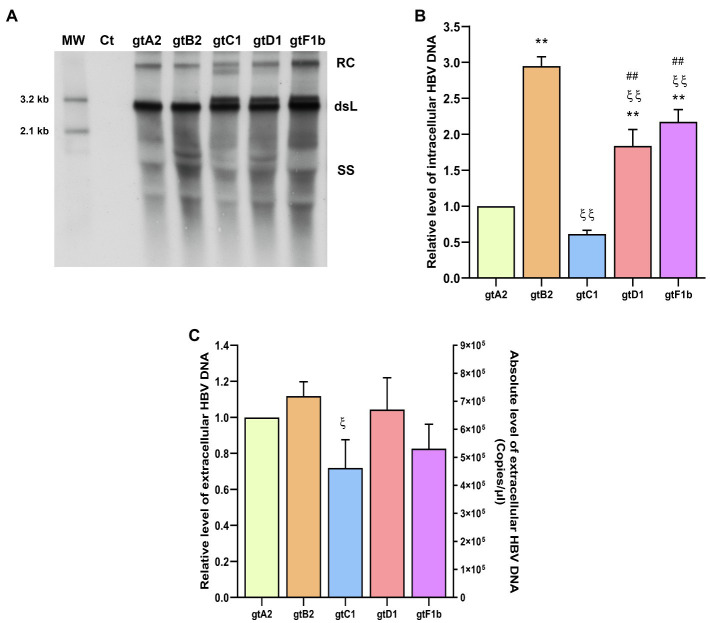
Analysis of HBV DNA levels among genotypes. HuH-7 cells were transfected with linear full-length HBV genomes of genotypes A2, B2, C1, D1, and F1b. Three days post-transfection, cells and culture supernatants were harvested. (A) HBV DNA replicative intermediates were assessed by Southern blot analysis. Ct: cell transfected with pUC19 empty vector (control); RC: HBV relaxed circular DNA; dsL: HBV double-stranded linear DNA; SS: HBV single-stranded DNA. (B) Relative intensity of the SS band was quantified using ImageJ software. The band corresponding to the dsL HBV DNA was not included in the quantitative analysis because this DNA may be partially derived from transfected input DNA. (C) HBV extracellular DNA levels were determined by qPCR. Shown values represent the mean±standard deviation of three independent experiments. *: difference in relation to gtA2, ξ: difference in relation to gtB2, #: difference in relation to gtC1 and &: difference in relation to gtD1. One symbol: p<0.005 and two symbols: p<0.0001.

