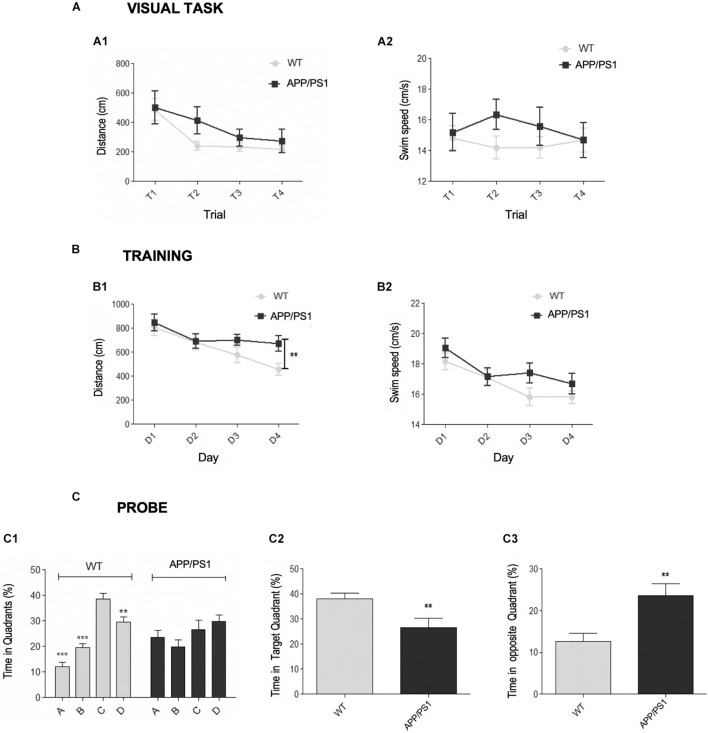
FIGURE 1.
Early spatial memory deficits in APP/PS1 model. (A–C) Morris Water Maze (MWM) test for APP/PS1 and WT 4.5-month-old mice. (A) Visual task. Two-way RM ANOVA analysis demonstrated that both genotypes correctly performed the visual task (escape latencies: [F(1, 123) = 0.26, p = 0.6152]; distance swum: [F(1, 123) = 1.74, p = 0.1946]). Differences in both latency [F(1, 123) = 7.06, p = 0.0002] and distance traveled [A1, F(3, 123) = 7.06, p = 0.0002] were found across the trials, demonstrating the improvement along the task-course. No significant interaction effect was found on either latency [F(3, 123) = 1.68, p = 0.1752] or distance [F(3, 123) = 0.62, p = 0.6037]. (A2) Respect to the swim speed no genotype [F(1, 123) = 1.12, p = 0.2965], trial [F(3, 123) = 0.18, p = 0.9069] or interaction [F(3, 123) = 0.76, p = 0.5203] effects were found. (B) Acquisition training. Two-way RM ANOVA (training days × genotype) over the training days did not reveal significant differences between the genotypes in either distance [B1, F(1, 123) = 2.54, p = 0.1189] or swim speed [B2, F(1, 123) = 1.83, p = 0.1838], neither interaction effect in distance [F(3, 123) = 1.70, p = 0.1716] nor velocity [F(3, 123) = 1.01, p = 0.3387]. Student’s t-test analysis demonstrated that APP/PS1 traveled more distance to reach the platform in the last training day (B1, D4: **p = 0.0095) than control group, without significant differences in velocity (B2, p = 0.3243). (C) Probe trial. (C1) One-way RM ANOVA intra-group analysis showed significant differences among the quadrants [F(3, 28) = 2.24, p < 0.0001] for WT group. Post hoc analysis showed that control mice spent more time in the target (C) than in the adjacent (B,D) or opposite (A) quadrants (**p < 0.01, ***p < 0.001). In contrast, there were no significant differences in the time spent by the APP/PS1 mice in any quadrant (p = 0.2116). T-test intergroup analysis showed significant differences between the genotypes in the time spent in both the target quadrant C (C2, **p < 0.01) and the opposite quadrant A (C3, **p < 0.01).

