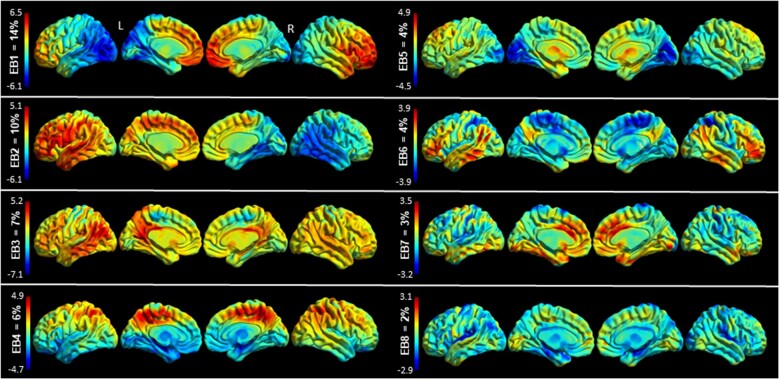
Figure 1.
Eigenbrains Surface renderings of the eight eigenbrains that explain over 50% of the variance of this sample. The percentage of cumulative variance explained by each eigenbrain is displayed above each colour bar. The colour bar encodes positive (red) and negative (blue) intensities for each eigenbrain. While a given participants’ scan can be approximated by a weighted linear combination of the above eigenbrains, the above images are not direct representations of hypometabolism or preserved metabolism. Rather, positive (red) regions indicate relatively preserved metabolism, and negative (blue) regions indicate relatively reduced metabolism. Furthermore, the signs of all the eigenbrains are indeterminate—if all the eigenbrain signs and participant weight signs are flipped about zero the decomposition would be equally valid. Inference occurs at the pattern—or eigenbrain—level, using the participant weights on the entire pattern.

