Fig. 2.

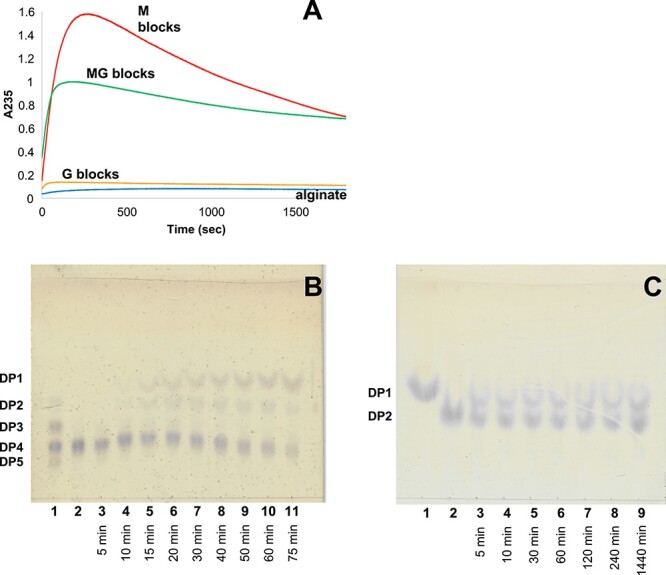
Degradation kinetics of AlyA3 on different substrates and TLC analysis of AlyA3 degradation products. (A) Degradation kinetics of M (red), MG (green), G blocks (orange) and alginate polymer (blue) by AlyA3. A235 was measured at 25°C for reaction mixtures (500 μL) composed of 100 mM Tris–HCl buffer, pH 7.0, 0.22% of substrate and 60 nM of enzyme. (B) Reaction was conducted at 30°C in 100 mM Tris–HCl buffer, pH 7.0, using sodium tetramannuronate 0.08% as substrate and 163 nM of the purified enzyme. Aliquots were sampled before adding the enzyme (lane 2) and after 5–75 min (lanes 3–11). Standard containing sodium di-, tri-, tetra- and penta-mannuronate was spotted on lane 1. (C) Reaction was conducted in the same conditions, using sodium dimannuronate as substrate. Aliquots were sampled before adding the enzyme (lane 2) and after 5–1440 min (lanes 3–9). Mannuronic acid was spotted on lane 1. This figure is available in black and white in print and in color at Glycobiology online.
