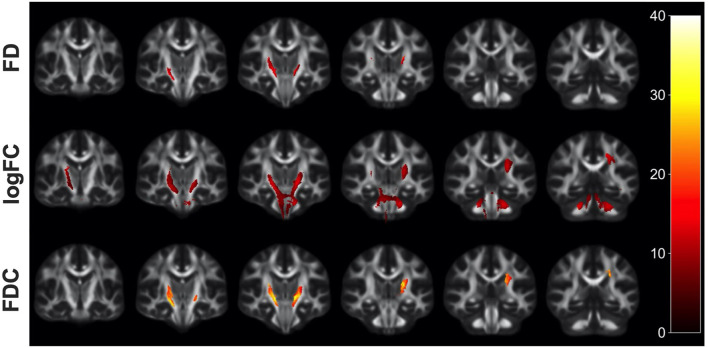
Figure 1.
Fiber tract-specific reductions in HIV+ compared to HIV– using whole-brain FBA. Significant fixels (FWE-corrected p-value) between HIV+ and HIV– groups displayed as the percentage decrease in the HIV+ group compared to healthy controls, displayed in coronal slices. FD, fiber density; logFC, fiber bundle cross section; FDC, fiber density and cross section.

