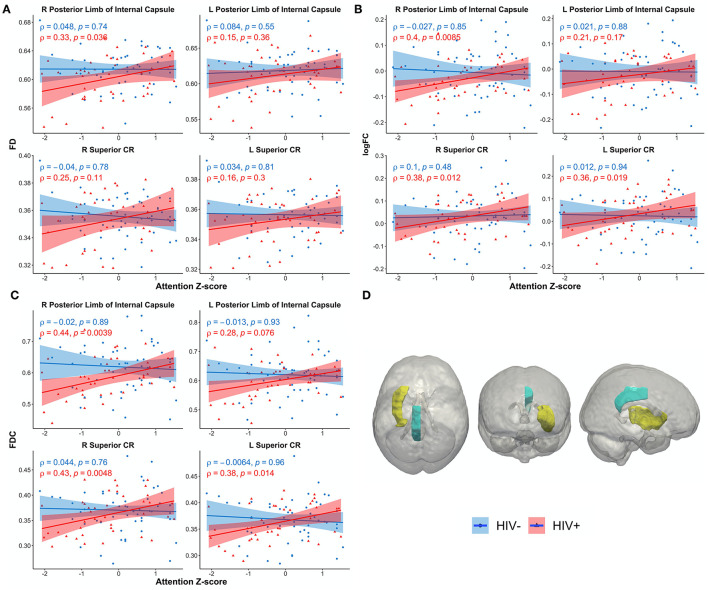
Figure 4.
Scatterplots show attention z-score as a function of FBA metrics: (A) fiber density (FD), (B) log of fiber cross section (logFC), (C) fiber density and cross section (FDC), (D) JHU white matter atlas and corresponding regions of interest. Only significant regions are shown. Solid lines represent linear fit, and shaded areas represent the 95% confidence interval. IC, internal capsule (yellow); CR, corona radiata (teal); CR, corona radiata.

