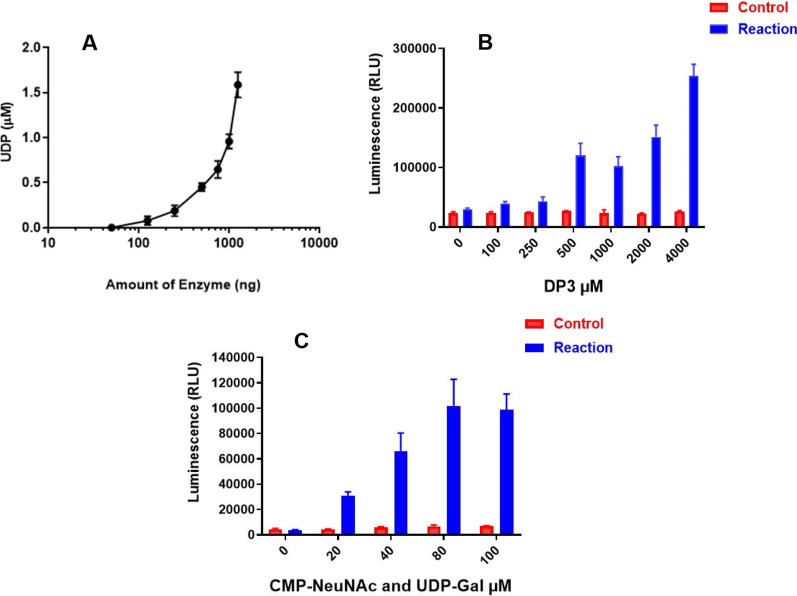
Fig. 3.
UDP-Glo assay optimization with sialic acid trimer (DP3). A Assay results with different NmW enzyme amounts with maximum activity observed with 1250 ng enzyme. B Assay results using different concentrations of DP3 acceptor indicate maximum activity with 4 mM DP3. C Results with different concentrations of CMP-NeuNAc and UDP-Gal show more activity in the presence of 80 µM of both donor sugars (Mean = 1,01,833 RLU) vs 100 µM (98,566.7). For panel A, the data point indicates the mean and error bars represent standard deviation. For panels B and C, top of bar graph indicates the mean and error bars represent standard deviation. Each panel illustrates representative examples of three individual experiments. All experiments were run with three replicates

