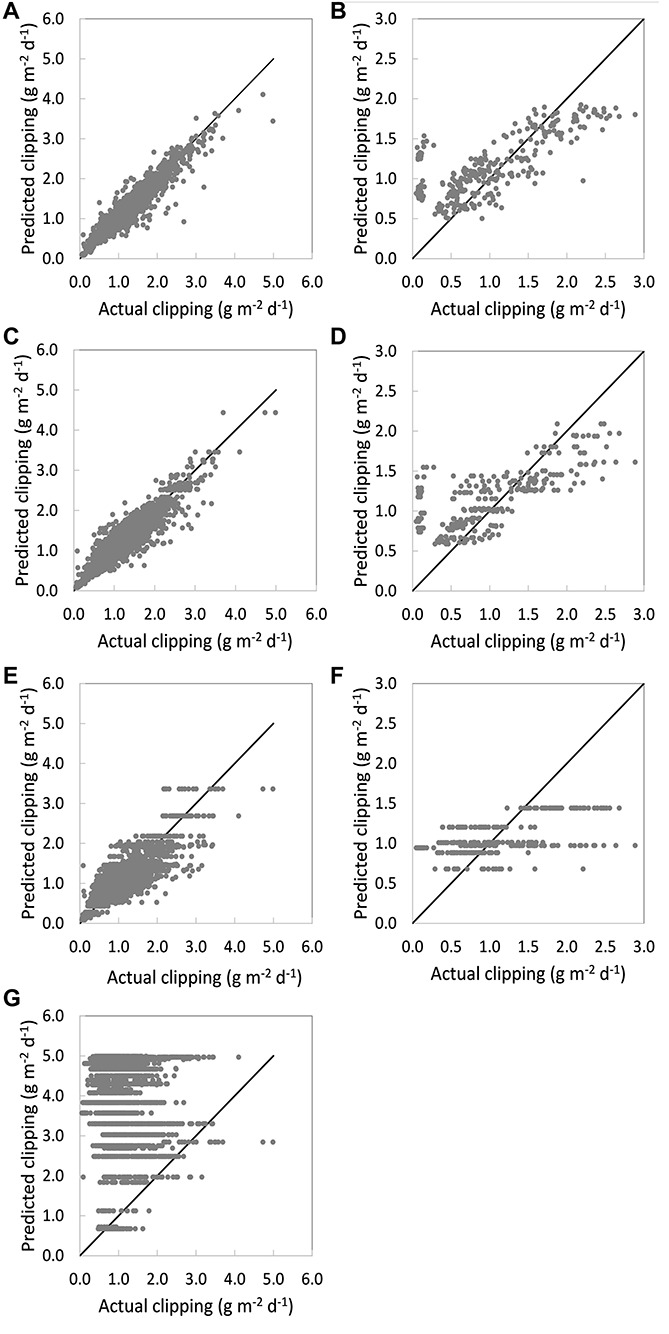
FIGURE 2.

Scatter plot of the model performances with (A) complete random forest (RF) model with all variables inputs on the training dataset; (B) complete RF model with all variables inputs on the validation dataset; (C) simplified RF model with the historical nitrogen (N) rate record, traffic intensity, and weather data on the training dataset; (D) simplified RF model with the historical N rate record, traffic intensity, and weather data on the validation dataset; (E) simplified RF model with only weather data input on the training dataset; (F) simplified RF model with only the weather data input on the validation dataset; (G) PACE Turf GP model.
