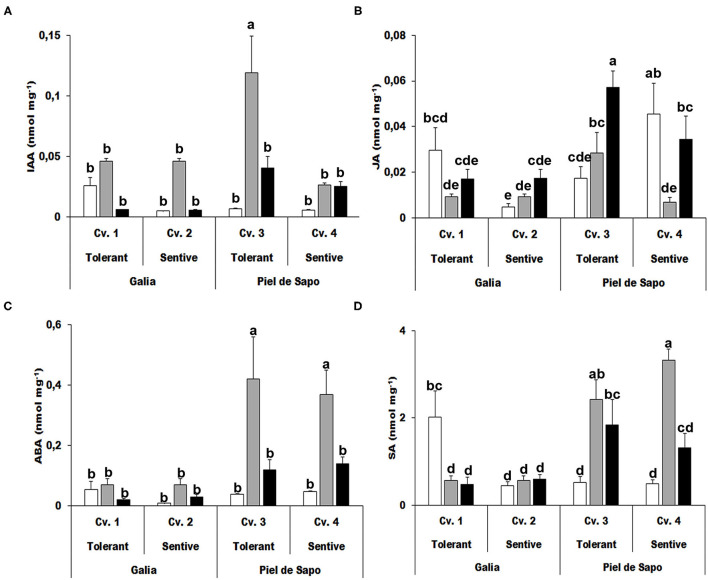
Figure 6.
Hormone concentrations. Indolacetic acid (IAA) (A); jasmonic acid (JA) (B); abscisic acid (ABA) (C), and salicylic acid (SA) (D) concentrations of Galia tolerant genotype (Cv. 1), Galia sensitive genotype (Cv. 2), Piel de Sapo tolerant genotype (Cv. 3), or Piel de Sapo sensitive genotype (Cv. 4) under control (white bars), salt stress (gray bars), and drought stress (black bars) conditions. Data with different letters differ significantly (p < 0.05), as determined by Duncan's MRT test (n = 5). Scale bars are mean ± SE. Experiment was replicated with similar results.

