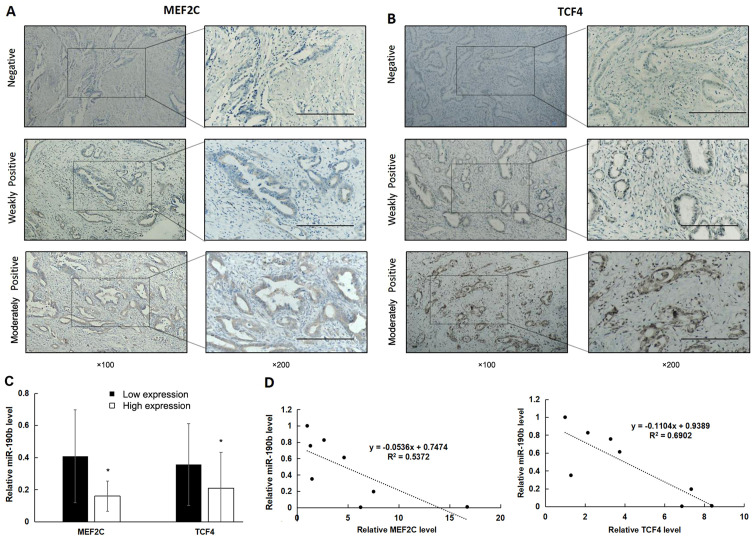
Figure 7.
High expression of MEF2C and TCF4 is associated with reduced miR-190b expression. (A and B) MEF2C and TCF4 expression in PDAC tissues was determined using immunohistochemistry. Positive expression is shown as brown-yellow particles distributed in the cell nucleus and cytoplasm. The cellular staining was classified using a scale of 0-2 as follows: 0, negative; 1, weakly positive; and 2, moderately positive. Scale bar, 200 µm. Magnification, ×100 (main panels) and ×200 (insets). (C) The non-parametric test demonstrated that miR-190b levels were significantly lower in samples with high expression of MEF2C and TCF4. (D) Pearson's correlation analysis demonstrated that miR-190b levels were significantly negatively correlated with MEF2C and TCF4 levels in pancreatic cell lines. Values are shown as mean ± SD. n=3. *P<0.05. miR, microRNA; MEF2C, myocyte enhancer factor 2C; TCF4, transcription factor 4; PDAC, pancreatic ductal adenocarcinoma.

