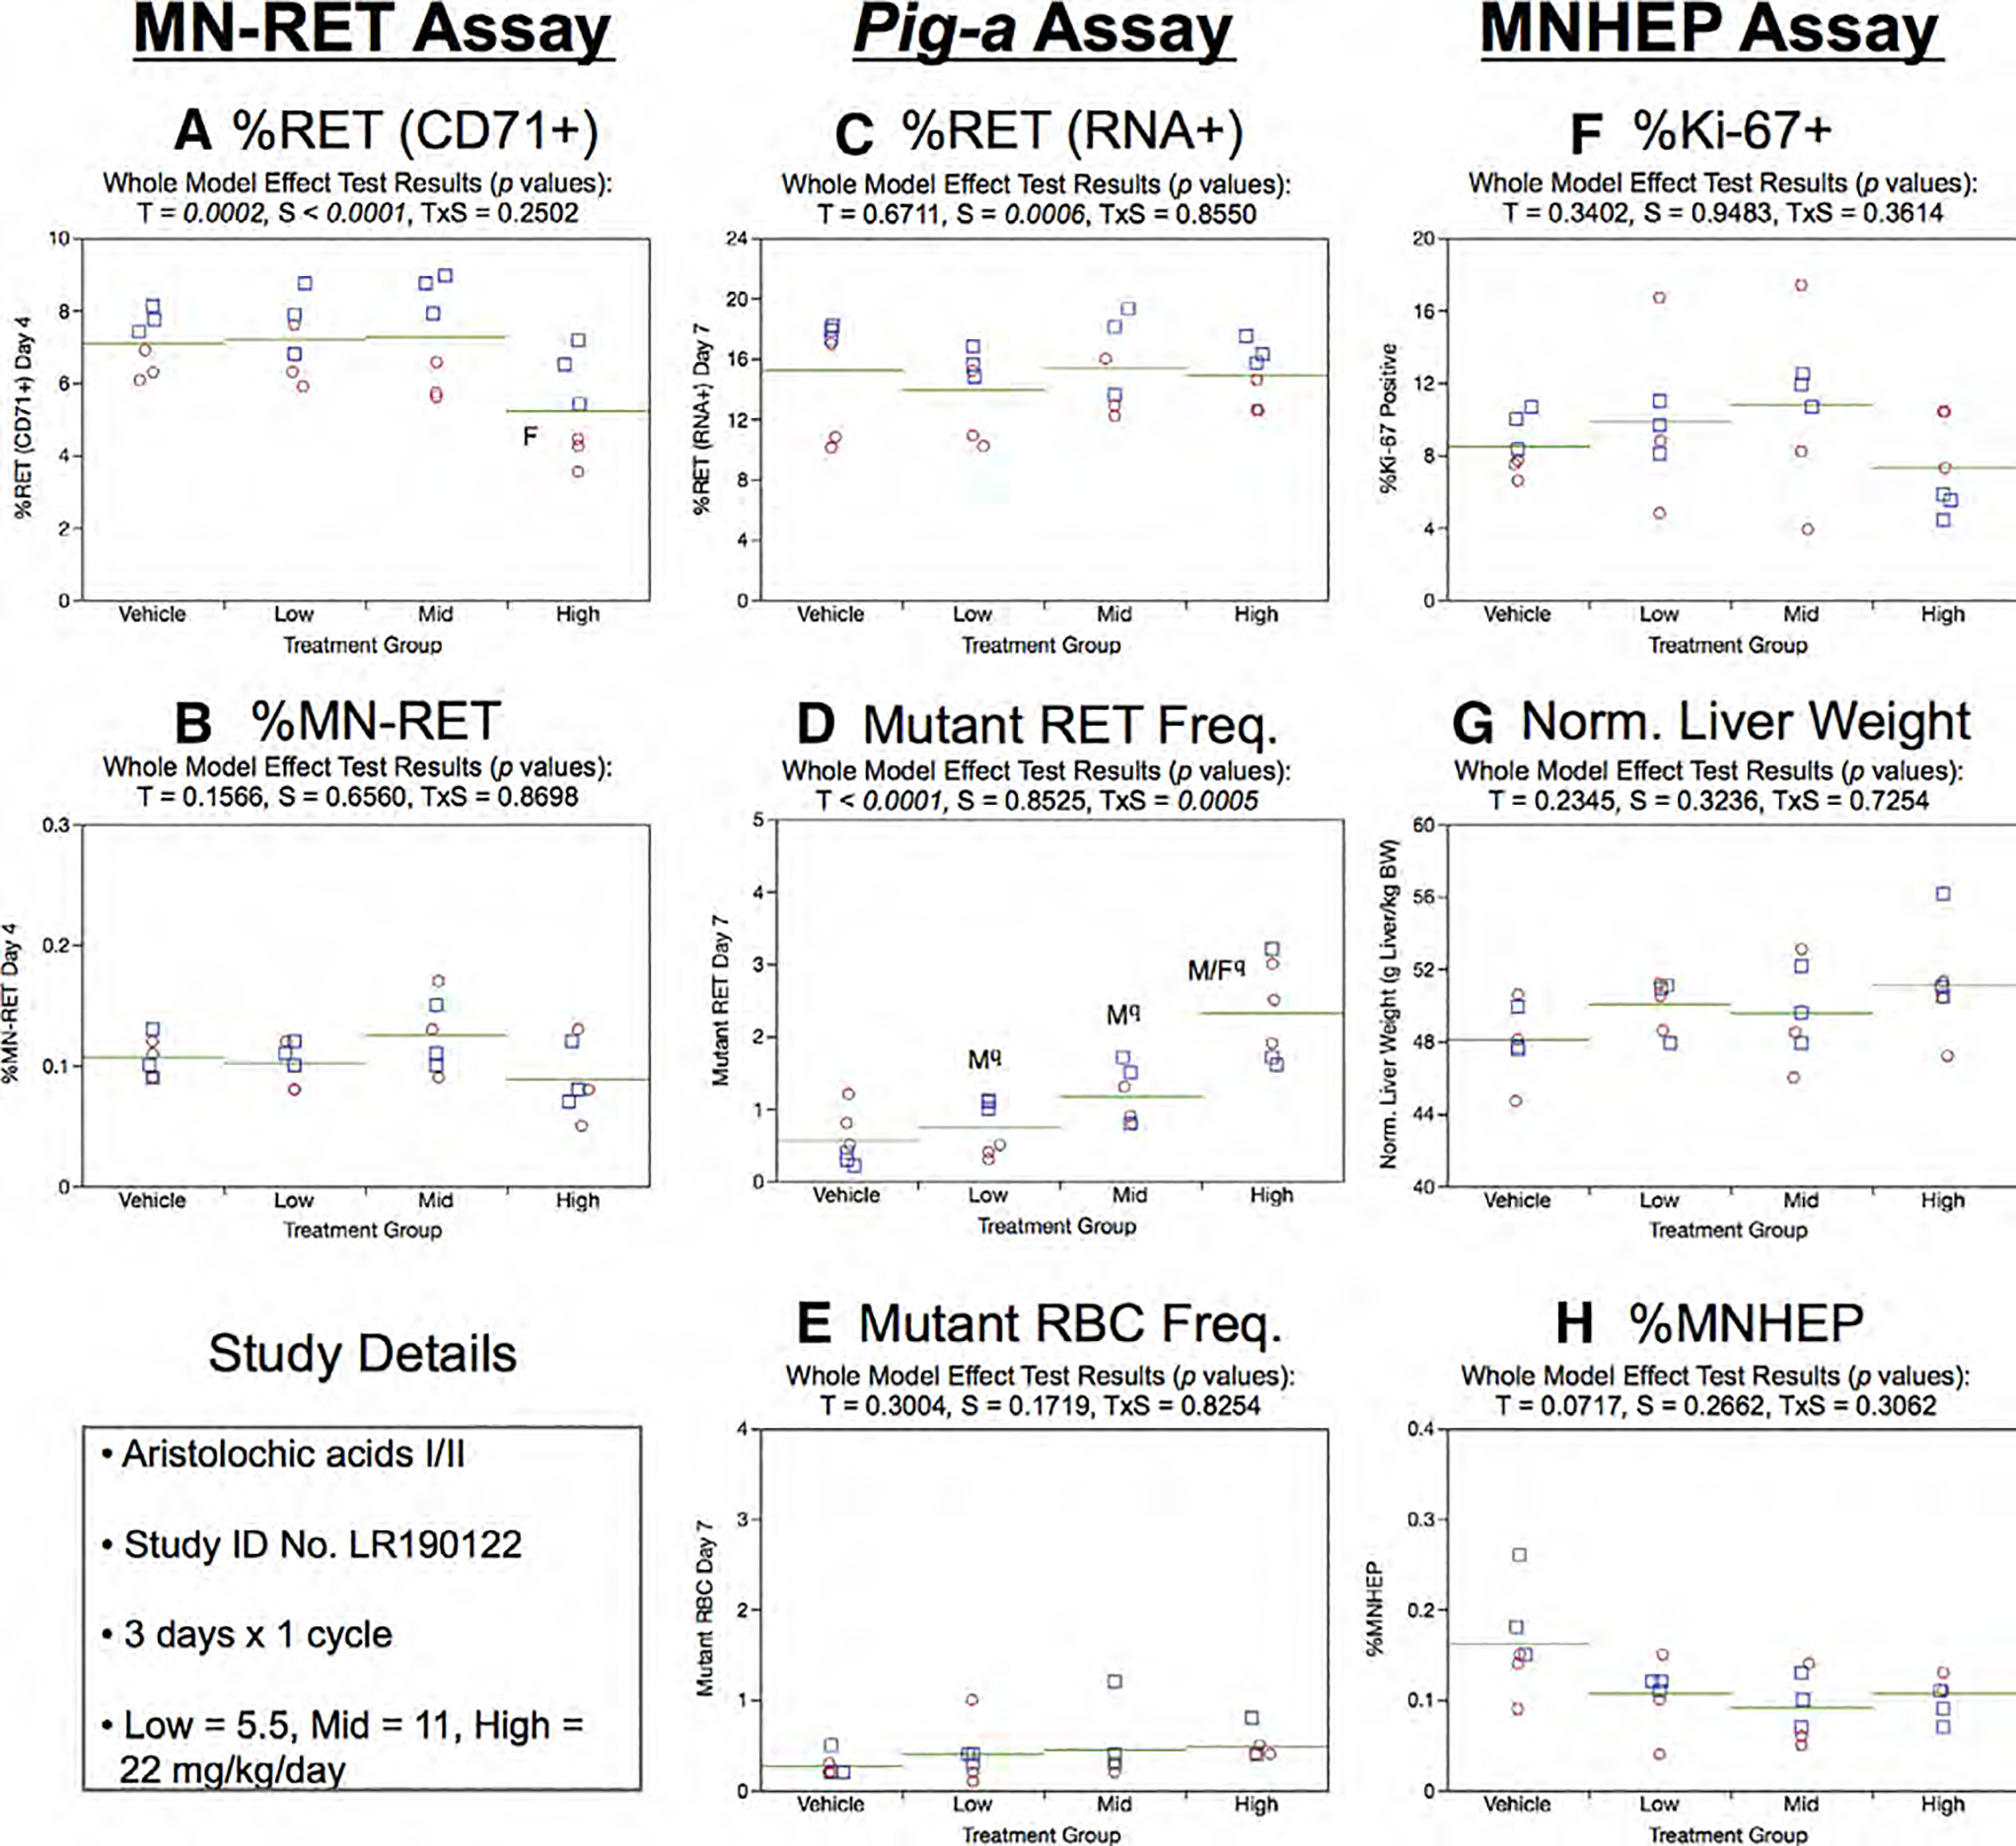
Fig. 2.

Results from the Aristolochic acids 3 × 1 study. Panels a and b show results for each of the four treatment groups in the micronucleated reticulocyte (MN-RET) assay, where a = percent CD71-positive reticulocytes [%RET (CD71+)] and b = percent MN-RET. Panels c, d, and e show results for each of the four treatment groups in the Pig-a mutation assay, where c = percent RNA-positive reticulocytes [%RET (RNA+)], d = number of mutant reticulocytes (Mutant RET, per 106 RET), and e = number of mutant erythrocytes (Mutant RBC, per 106 RBC). Panels f, g, and h show results for each of the four treatment groups in the MNHEP assay, where f = percent Ki-67-positive hepatocyte nuclei (%Ki-67+), g = Normalized liver weights (g liver/kg body weight), and h = percent micronucleated hepatocytes (%MNHEP). Note that for each panel, a–h above: squares = individual males, circles = individual females, and horizontal lines = group means. Two-way ANOVA p-values are provided at the top of each graph, whenever treatment was significant. Dunnett’s tests were used to identify the exposure group(s) that were significantly different than vehicle controls, with significance denoted by “M” (males) and “F” (females). The use of superscript q in panel d denotes Pig-a statistical significance is qualified because more than half the mutant cell frequencies were within the historical negative control distribution.
