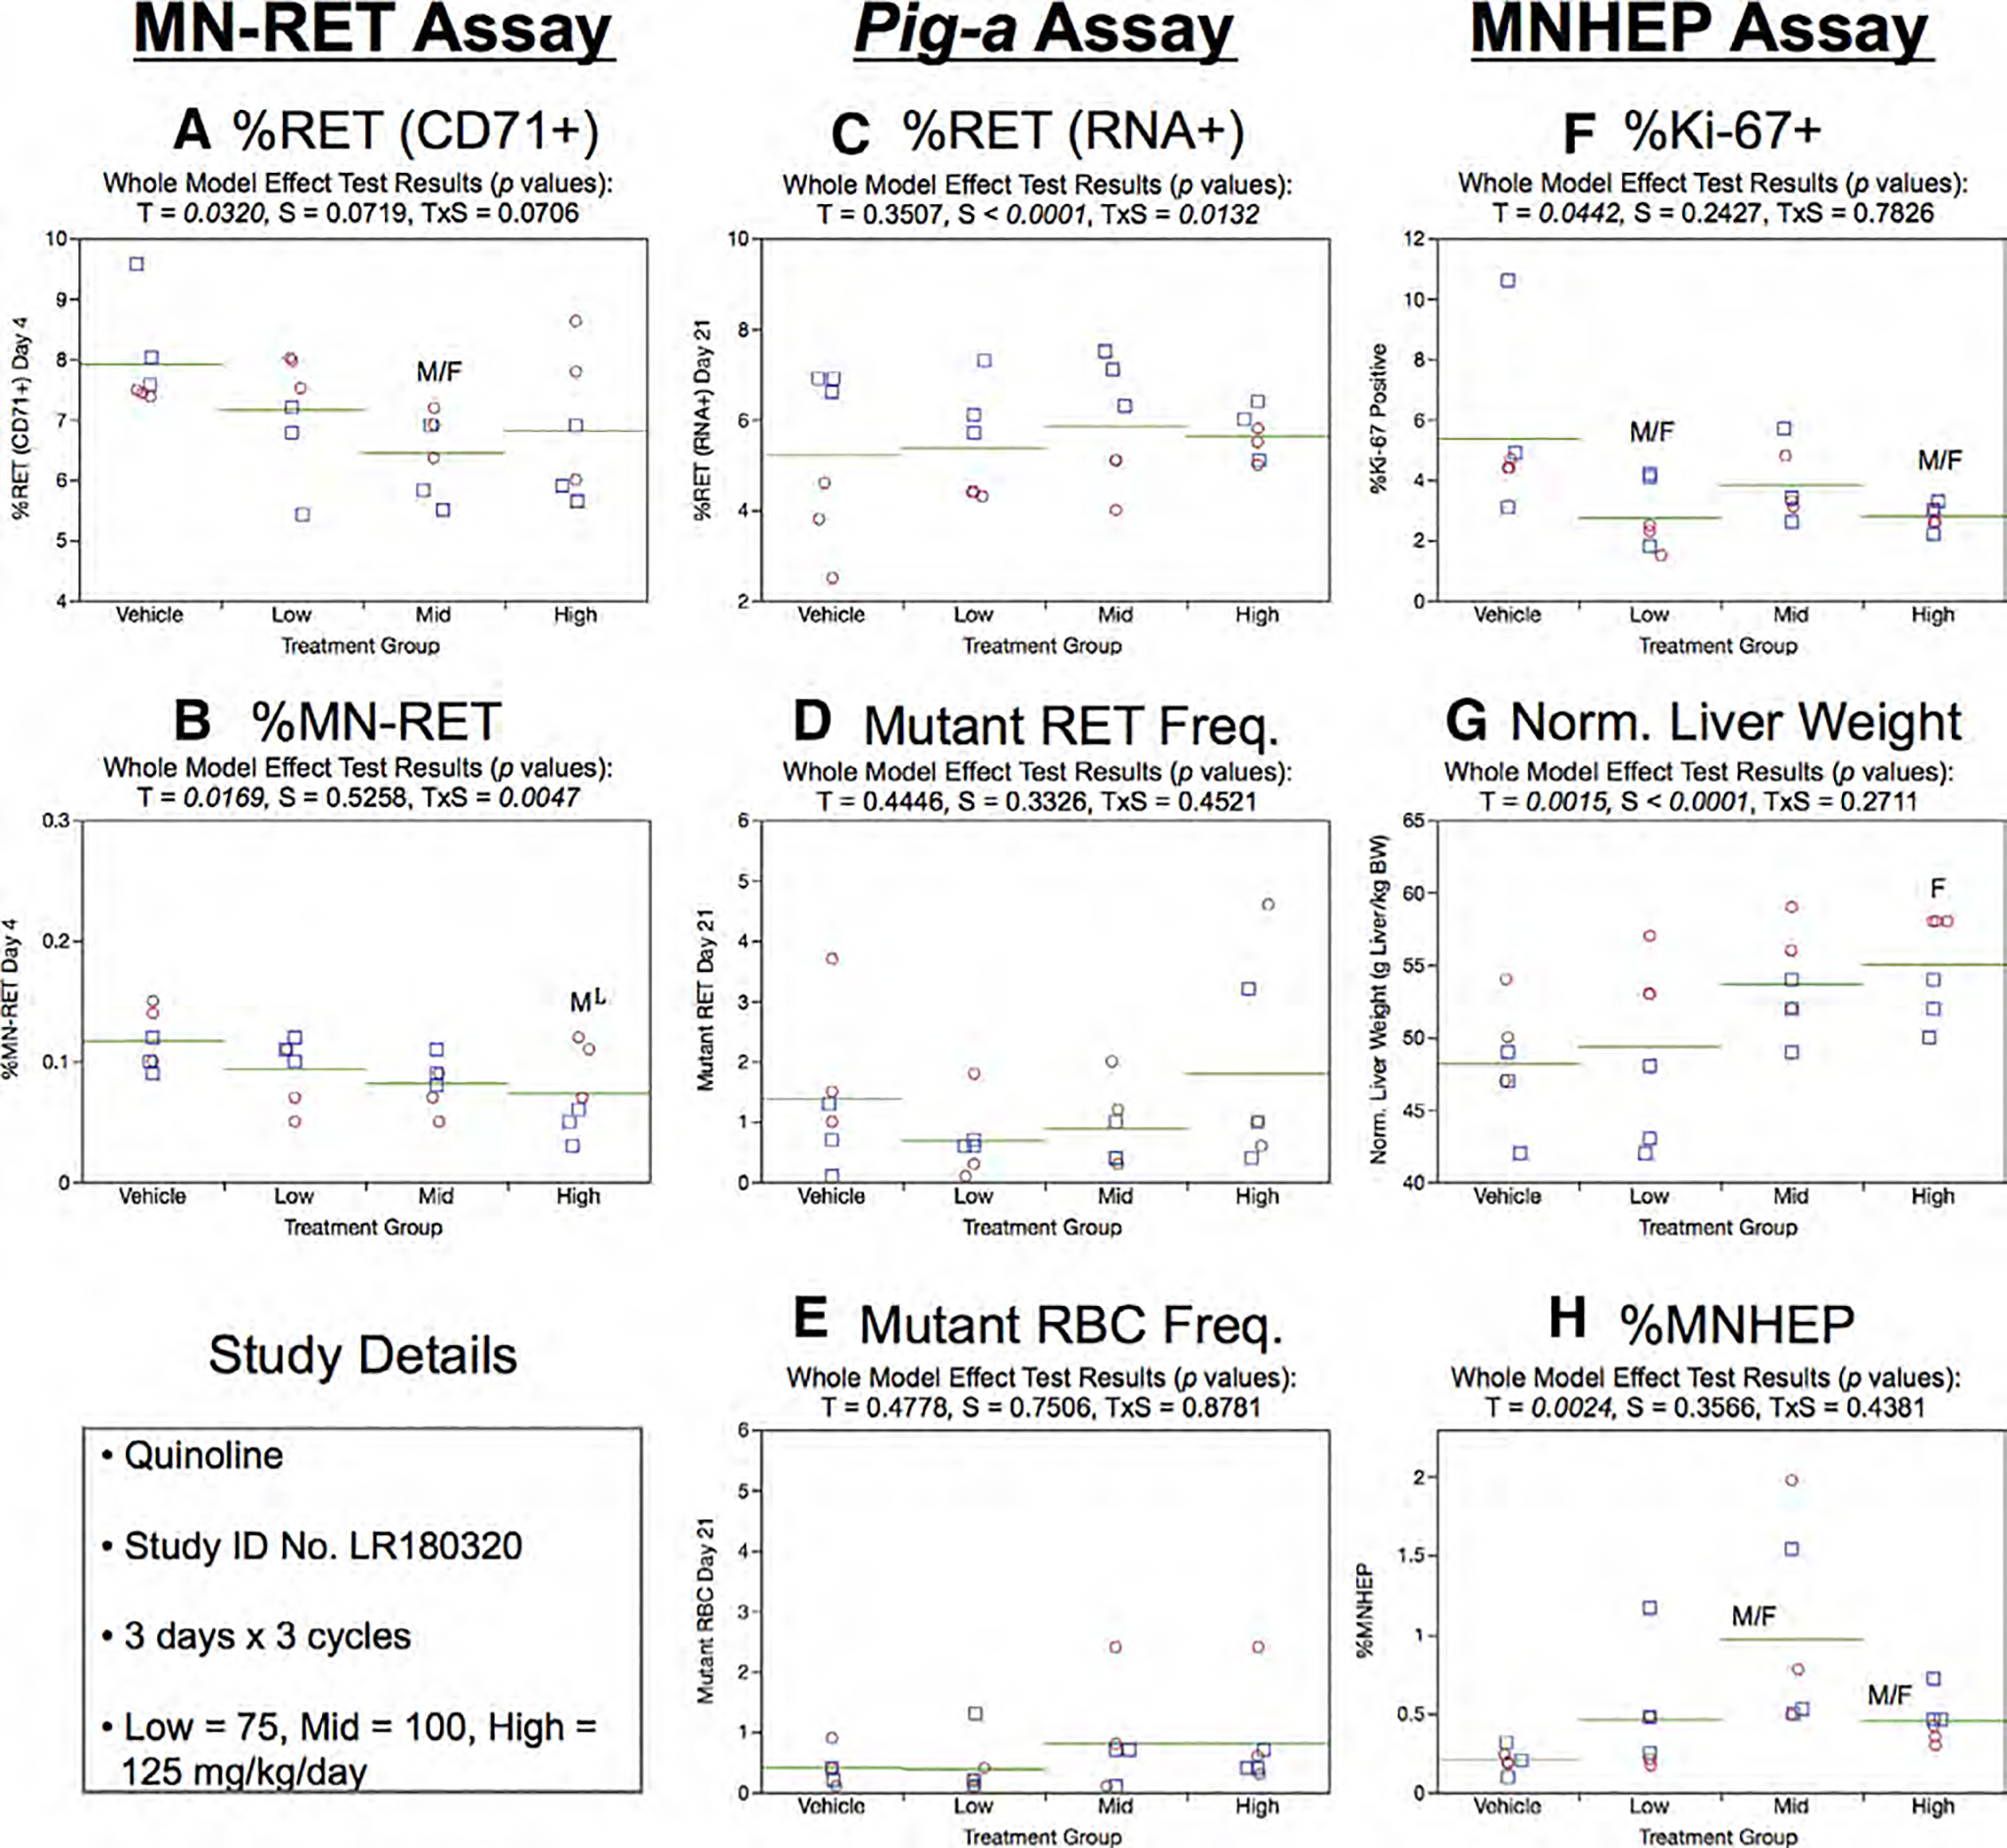
Fig. 25.

Results from the Quinoline 3 × 3 study. The same abbreviations and graph formats described in Figure 2 legend are used here. The use of superscript L in panel b denotes the high dose group exhibited lower, not higher %MN-RET relative to controls.
