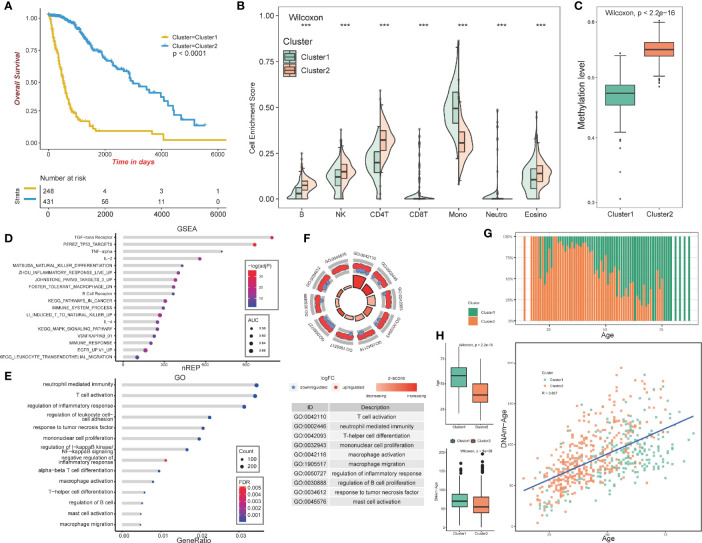
Figure 2.
Construction and analysis of consensus cluster. (A) Kaplan–Meier survival analysis of the two clusters showing clear separation. (B) Tumor-infiltrating immune analysis of the two clusters based on TCGA methylation set. (C) Methylation levels of the two clusters. (D) ebGSEA result of the two clusters. (E, F) GO functional enrichment analysis of the two clusters. (G) Age distribution of the two clusters. (H) Box plot showing the age and DNA methylation age difference between the two clusters, Scatter plot revealing correlations of the DNA methylation age-age correlation coefficients between cluster1 and cluster2. ***p <0.001.

