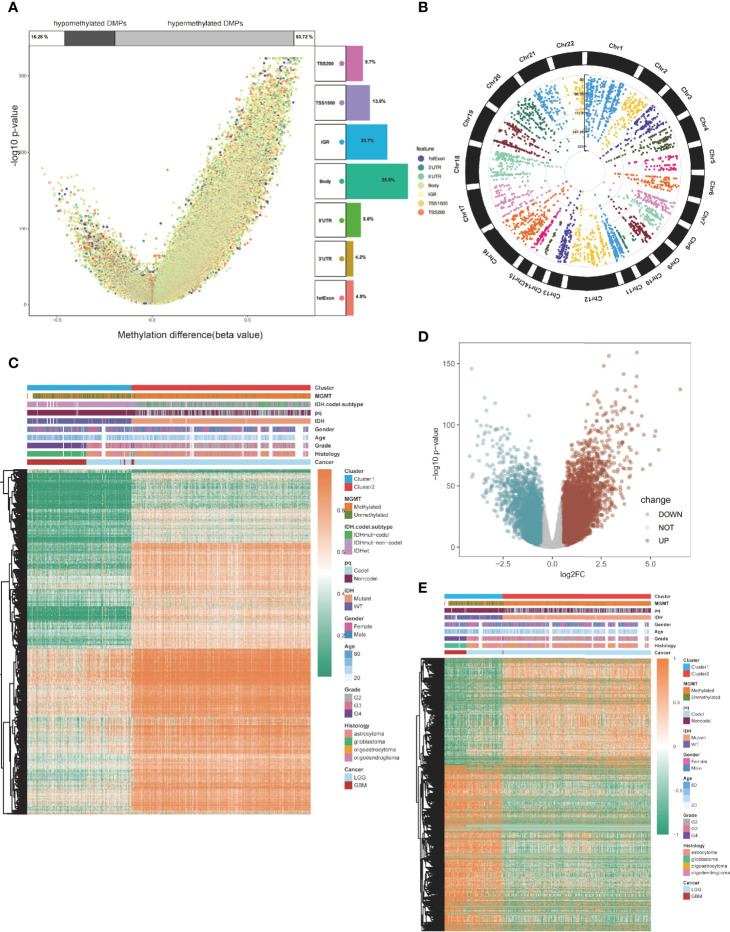
Figure 3.
Global DMPs and DEGs of the two clusters. (A) Volcano plot. Proportions of hypermethylated and hypomethylated DMPs are shown on top. The distribution of DMPs’ feature is shown on the right. (B) The manhattan plot of the DMPs. (C) Heatmap of the two clusters based on the TCGA methylation set. High methylation, orange; low methylation, green. (D) Volcano plot of the DEGs. (E) Heatmap of the twp clusters based on the TCGA RNA-seq cohort. High expression, red; low expression, green.

