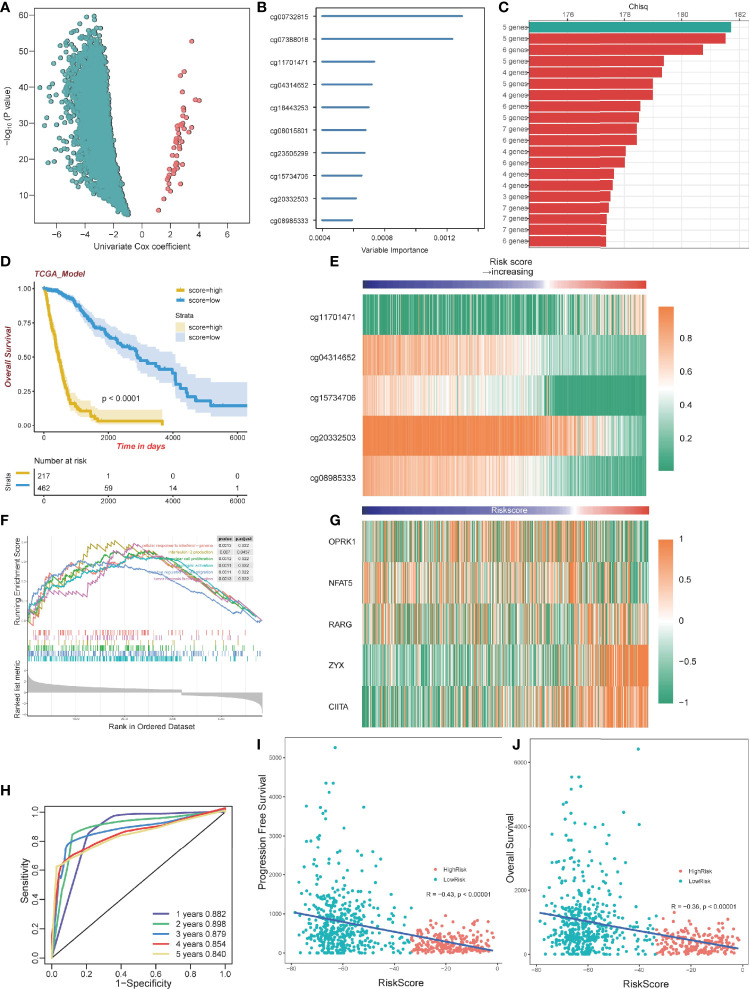
Figure 5.
Construction of a prognostic model. (A) Volcano plot showing the selected probes by univariate Cox regression analysis. The horizontal axis represents log2(HR) (B) Variable importance of 10 probes determined by random survival forest analysis. (C) Top 20 combinations of signatures were selected after Kaplan–Meier analysis according to the chi-square value. A five-probe signature with the highest chi-square was identified. All 20 signatures had a significant p-value Kaplan–Meier analysis. (D) Kaplan–Meier analysis of the high-risk and low-risk group. (E) Heatmap of the five selected methylation probes sorted by risk score. (F) GSEA plots for the enrichment of immunogenic and oncogenic signaling pathways from the GO. (G) Heatmap of gene expression corresponding to the selected five probes sorted by risk score. (H) ROC curve of the TCGA dataset. (I) The correlation between PFS time and risk score. (J) The correlation between OS time and risk score.

