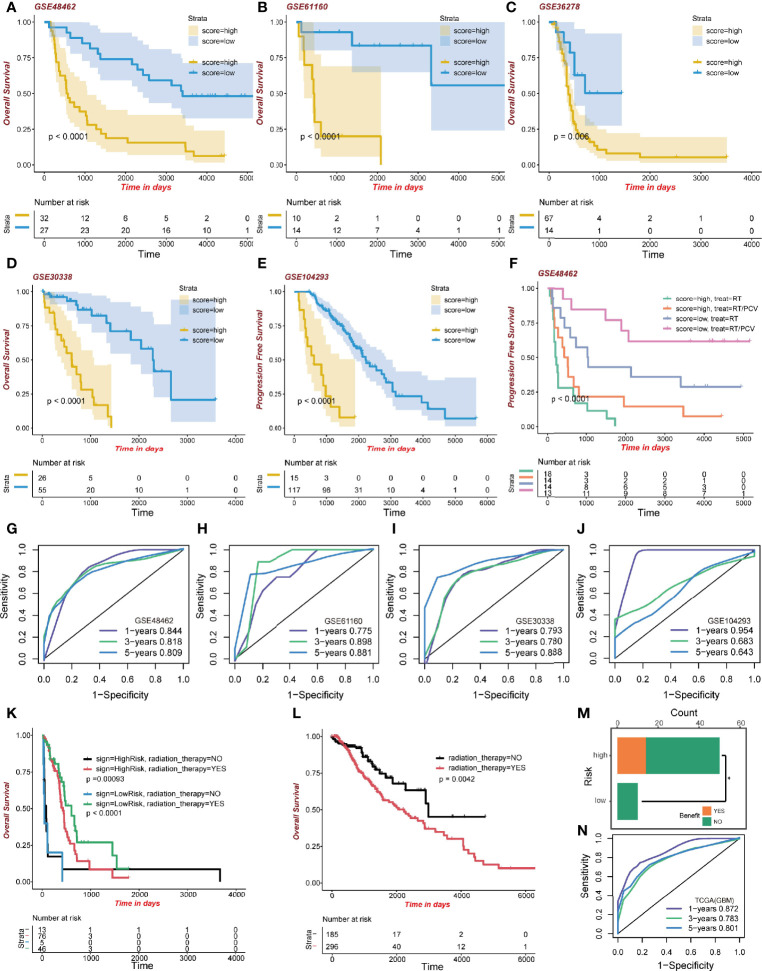
Figure 6.
Validation of the signature. (A–E) Kaplan-Meier curve of high-risk and low-risk score groups in the GEO cohort. (F) Kaplan-Meier survival analysis of different treatments on the GSE48462 dataset. Both high-risk and low-risk groups benefited from PCV. (G–J) ROC curve of the GEO dataset. (K) Kaplan-Meier curve of radiation therapy in the high- and low-risk GBM dataset group of TCGA. (L) Kaplan-Meier curve of radiation therapy in the LGG dataset group of TCGA. (M) Benefit from RT/PCV treatment in the GSE48462 dataset. (N) ROC curve of the GBM dataset group in TCGA.

