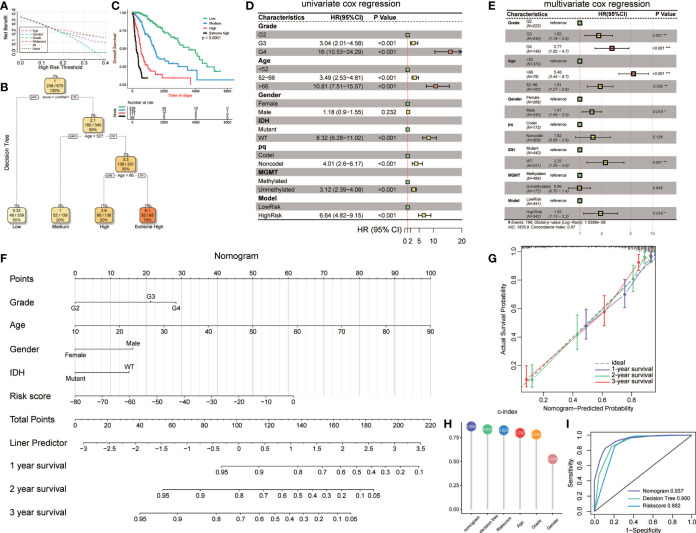
Figure 7.
Construction and validation of the clinic-associated model. (A) Decision curve analysis (DCA) for age, gender, grade, and risk score, revealing the risk score revealed better survival outcomes than the other variables. (B) Patients with risk score and age were used to set up a detailed glioma risk stratification. (C) Kaplan-Meier survival analysis of the four precise risk subtypes in the TCGA dataset. (D) Forest plot of the univariate Cox proportional-hazards model survival analysis of various parameters. (E) Forest plot of multivariate Cox proportional-hazards model survival analysis of various parameters. (F) Details of the nomogram. (G) Calibration curve showing a high accuracy of the nomogram. (H) Comparison of the predictive power of multiple models. (I) ROC curve of the nomogram, decision tree, and risk score model in 1 year. HR, hazard ratio; CI, confidence interval. *p<0.05; **p<0.01; ***p <0.001.

