
Figure 2. Exposure-Stratified Cumulative Incidence Functions.
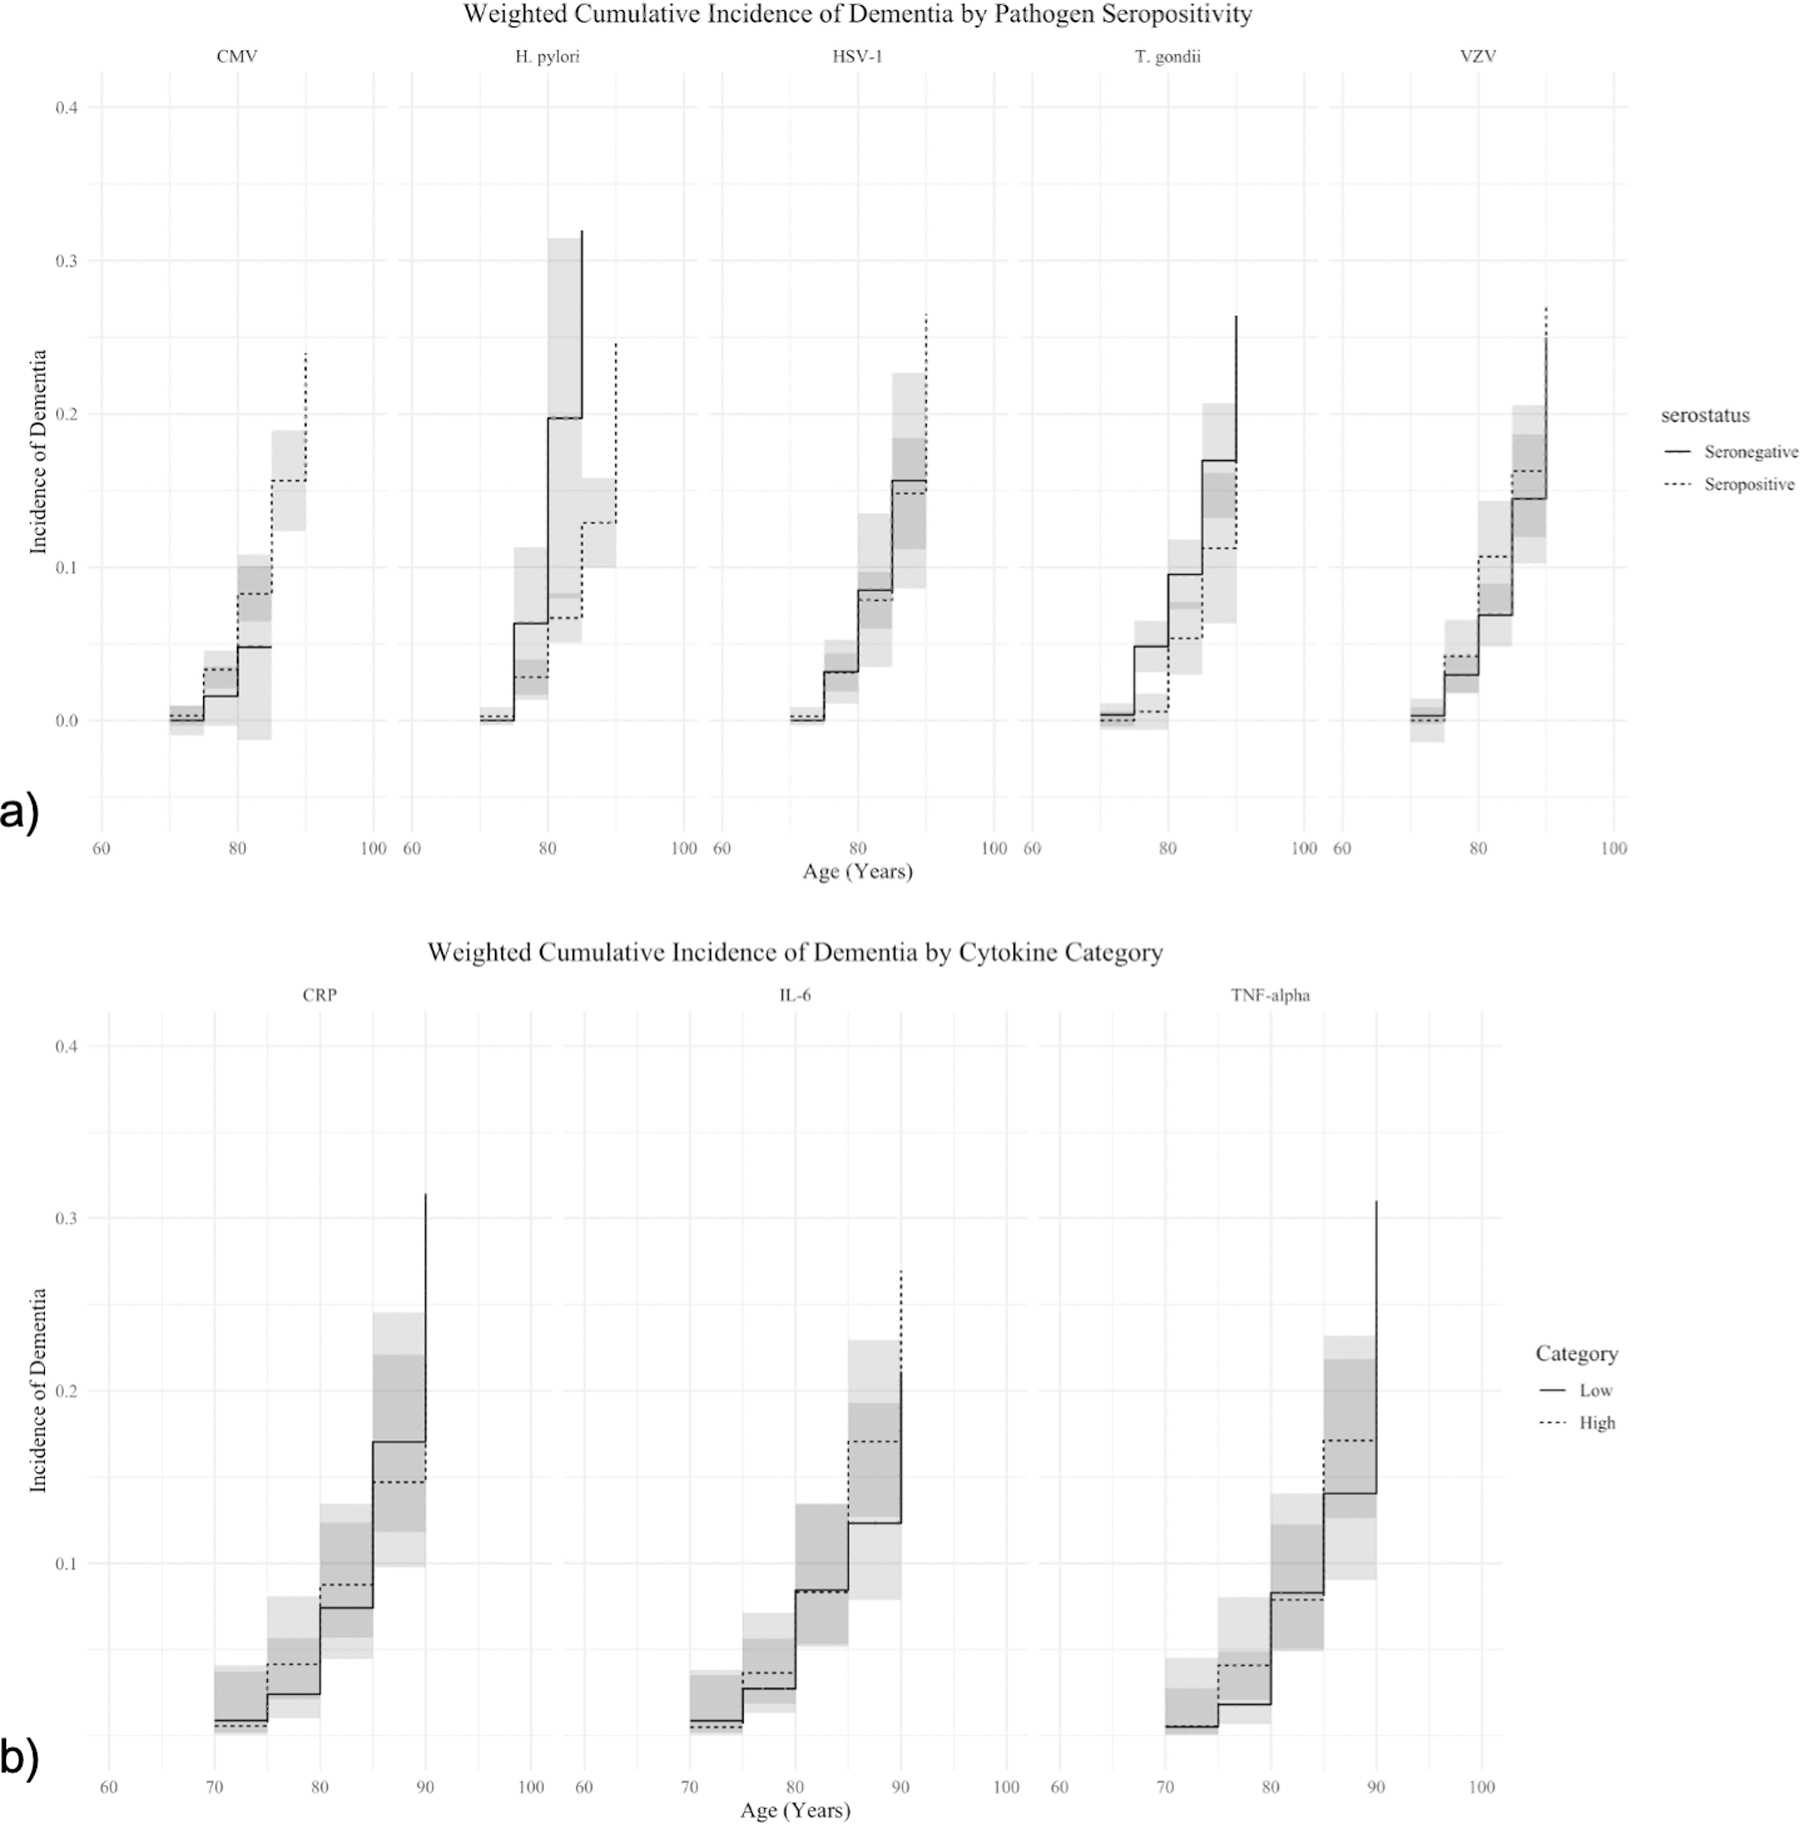
This figure demonstrates the relationship between category of immune biomarker and the incidence of dementias. Outputs are the IP-weighted, stratified cumulative incidence functions (95% CIs in grey) for each biomarker. Panel a) shows the relationships for pathogen seropositivity and Panel b) shows the relationships for high and low levels of cytokines. All values come from final, IP-weighted cumulative incidence models were estimated using the Aalen-Johansen estimator.