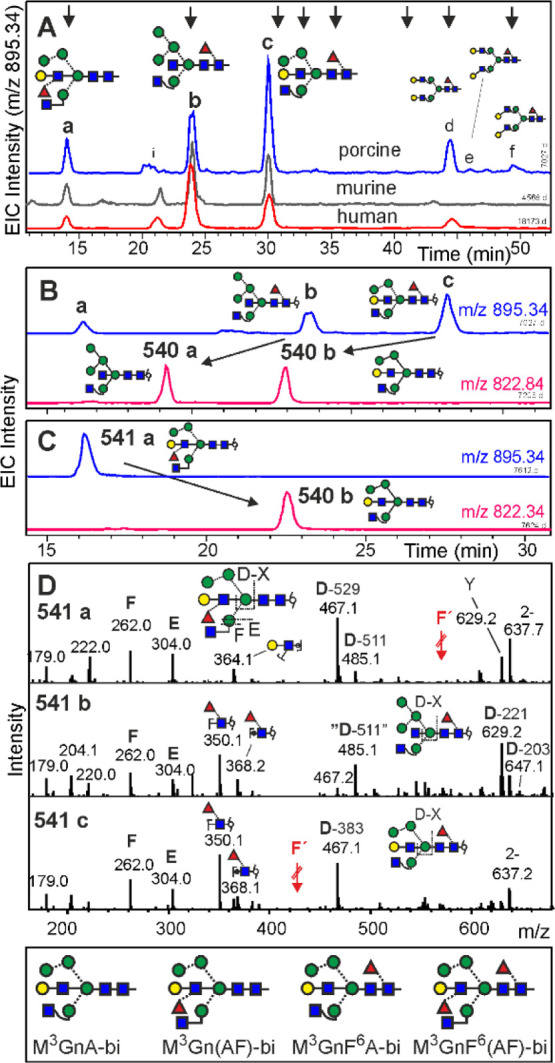
Figure 4.

Analysis of brain N-glycans of H5N4F1 composition by PGC-LC-ESI-MS/MS. Panel A shows the EIC traces for brains from the pig, mouse, and human (from top to bottom). Arrows at the top indicate elution positions of the glyco-TiGr standard mix. Panel B illustrates the effect of bovine kidney fucosidase on pig brain glycans and panel C does so for the effect of α3/4-specific fucosidase on isolated peak 541a. The negative ion CID spectra of the three peaks (panel D) all contain E- and F-ions arising from an unsubstituted 3-arm.49 Red arrows depict the positions of F-ions in the case of the relevant decorations. D-ions in the established sense would include the bisecting GlcNAc.49 The masses of the ejected bisecting groups of D-ions were calculated after resolving the structure. Fragment Y in 541a may hint at a co-existing Man5 structure, for which, however, reasoning about structures and elution times leaves hardly any possibility for this. The box at the bottom displays the structures of four brain N-glycan peaks containing bisecting LacNAc. Positive mode CID spectra are shown as Supporting Information S11.
