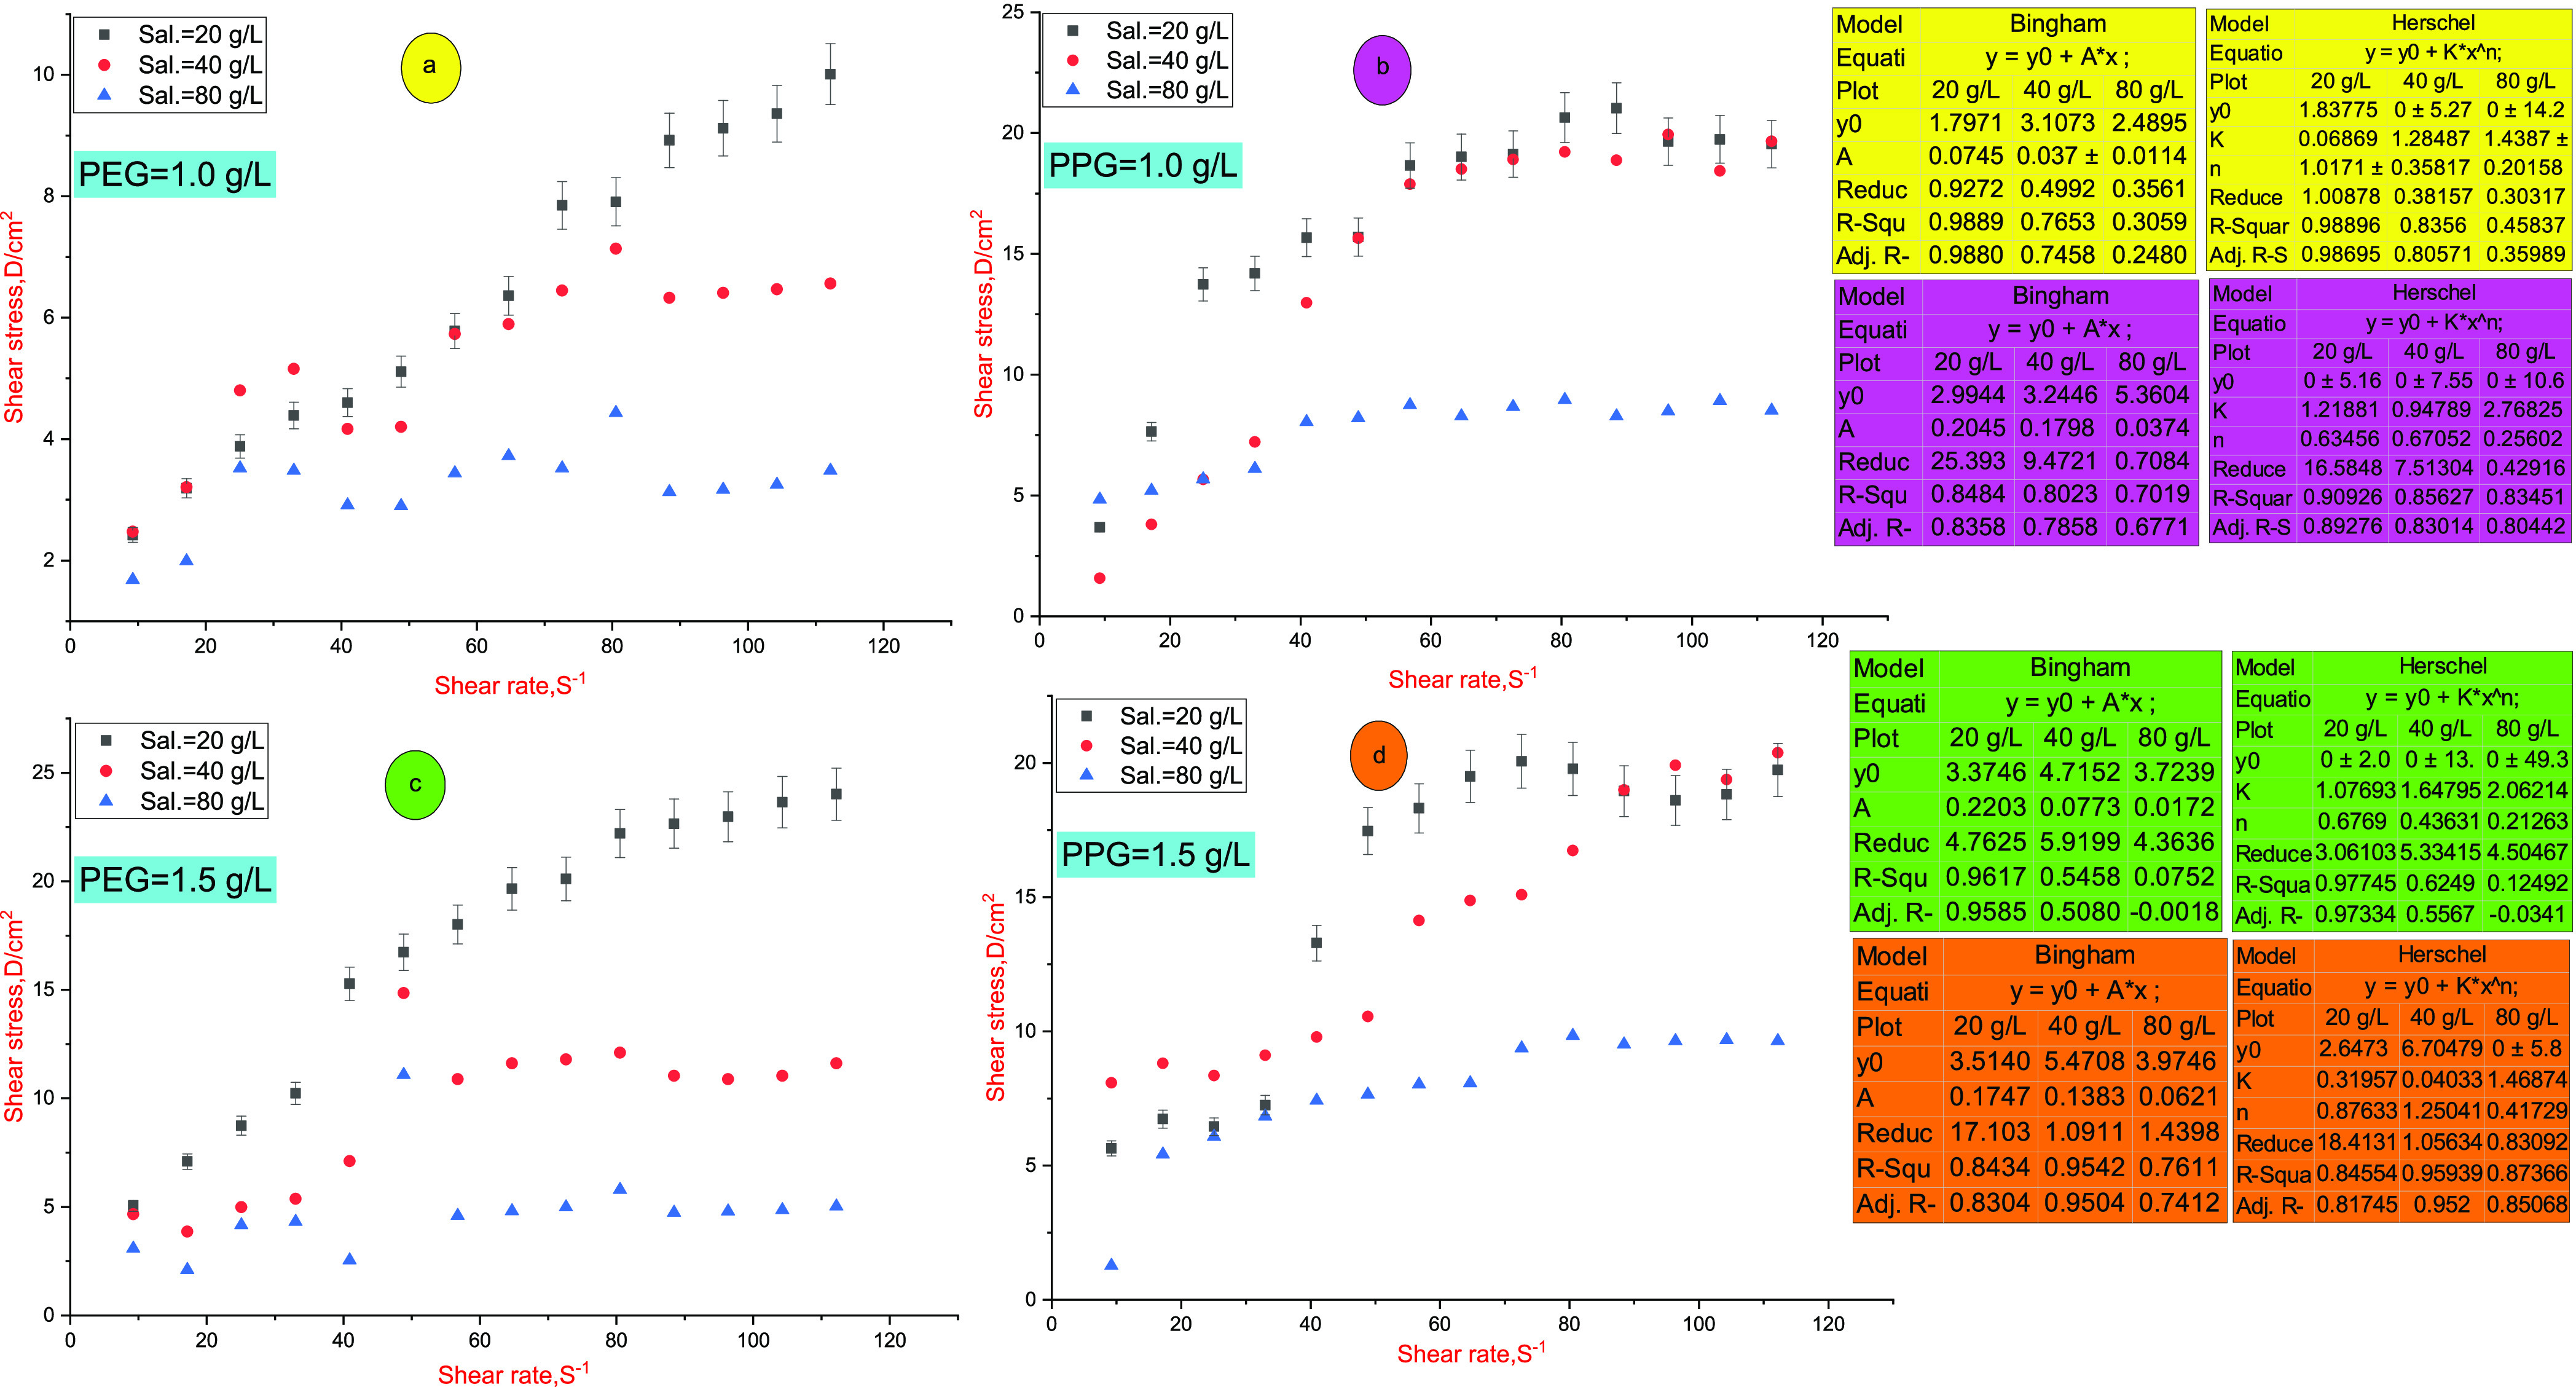
Figure 2.

Shear rate–shear stress profiles (Bingham and Herschel–Bulkley models) at different salinities and temperature of 80 °C; (a, b) stress–shear profiles of PEG and PPG hydrogels, respectively, at a concentration of 1.0 g/L; (c, d) stress–shear profiles of PEG and PPG hydrogels, respectively, at a concentration of 1.5 g/L. The calculated parameters were assigned to their consistent color.
