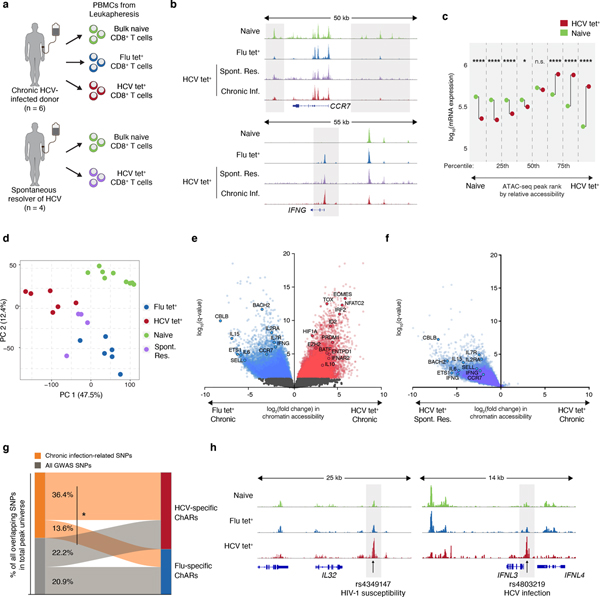
Figure 1. Distinct epigenetic changes underlie CD8+ T cell responses to influenza and chronic HCV infection.
(A) Schematic diagram of the experiment. (B) Representative ATAC-seq tracks at the CCR7 and IFNG gene loci. (C) Median mRNA expression of genes neighboring chromatin accessibility regions, which were partitioned into 8 bins based on relative accessibility in naïve vs. HCV tet+ CD8+ T cells. Gene expression from naïve T cells is denoted in green, and that from HCV tet+ cells in red. (D) Principal component analysis of naïve, HCV tet+ and Flu tet+ CD8+ T cell populations across 6 patients. (E) Volcano plot highlighting differential transcripts present in Flu tet+ CD8+ T cells versus HCV tet+ CD8+ T cells (colored dots, FDR < 0.05). (F) Reprojection of Flu-specific ChARs from (E) onto volcano plots comparing HCV tet+ in spontaneously resolved versus chronic infection. (G) Classification of SNPs falling within HCV-specific (red) and Flu-specific (blue) ChARs. SNPs that were subcategorized into those associated with chronic viral infection are summarized in Supplementary Table 3. (H) Representative ATAC-seq tracks at the IL32 and IFNL3 gene locus, showing the location of a SNP associated with HIV-1 susceptibility and HCV infection, respectively.

