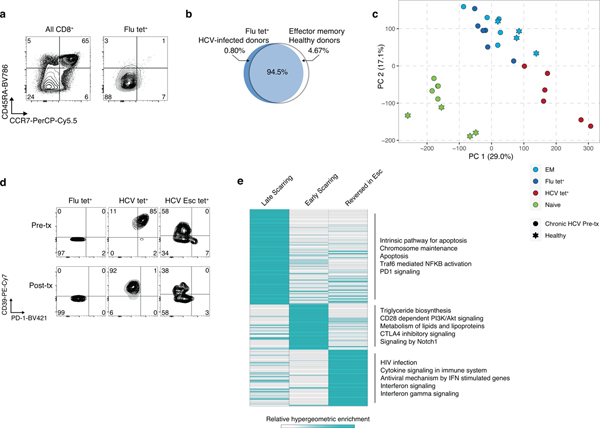
Extended Data Fig. 4.
(A) CCR7 and CD45RA staining on all CD8+ T cells (left) and Flu-specific T cells (right). (B) Venn diagram of ChAR overlap in Flu tet+ cells (bottom) from HCV-infected donors and healthy donors. (C) PD-1 and CD39 staining on tetramer populations before (top) and after (bottom) DAA therapy. (D) Combined principal component analysis of naïve, effector memory, HCV-, and Flu- specific CD8+ T cells from the healthy and HCV cohorts. (E) Heatmap showing pathway enrichment (rows) within clustered ChARs from Figure 4g (columns).

