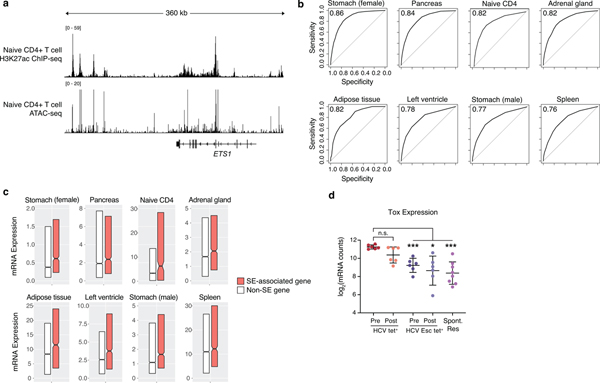
Extended Data Fig. 5.
(A) H3K27ac ChIP-seq signal (top) and ATAC-seq signal (bottom) at the ETS1 gene locus. (B) ROC plots of varying cutoff for ATAC-based ranking of super-enhancer to predict bona fide super-enhancers defined using matched tissue-specific H3K27ac ChIP-seq. (C) Boxplots of tissue-specific mRNA expression, partitioned by genes with or without an associated super-enhancer. Centre, median; box limits, first and third percentiles. (D) Tox mRNA expression in HCV tetramer populations before and after DAA therapy. Mean ± s.d., two-sided Student’s t-test with Welch’s correction; *P ≤ 0.05, **P ≤ 0.01, ***P ≤ 0.001. N = 6 donors.

