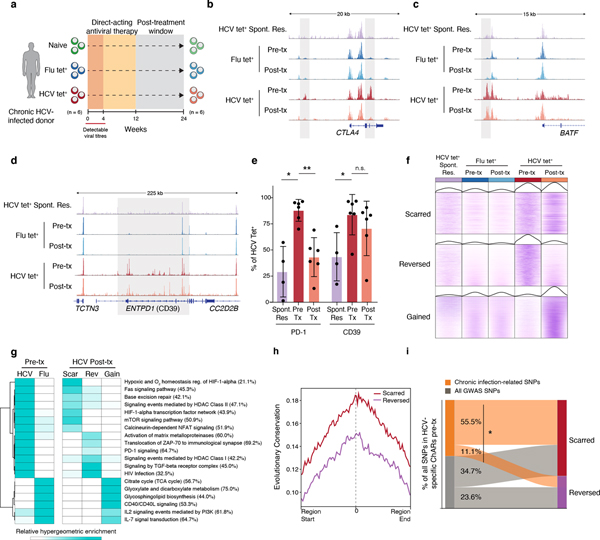
Figure 3. HCV-specific CD8+ T cells retain epigenetic scars of exhaustion despite cure of chronic infection.
(A) Schematic diagram of the treatment regimen. (B-D) Representative ATAC-seq tracks at the CTLA4 (B), ENTPD1 (C) and BATF (D) gene loci. (E) Frequency of PD-1 and CD39 in HCV-specific CD8+ T cells from spontaneously resolved and chronic HCV infection. Mean ± s.d., two-sided Student’s t-test with Welch’s correction; *P ≤ 0.05, **P ≤ 0.01, ***P ≤ 0.001. N = 6 donors for chronic HCV, N = 4 donors for resolved HCV infection. (F) Chromatin accessibility at “scarred”, “reversed” and “gained” ChARs within the indicated conditions from the HCV cohort. (G) Heatmap showing pathway enrichment (rows) within HCV-specific and Flu-specific ChARs pre-treatment, and within scarred, reversed and gained ChARs post-treatment (columns). Percentage of genes observed within total gene-set is denoted in parentheses for the “scarred”, “reversed” and “gained” clusters, respectively. (H) Average evolutionary conservation across the length of all ChARs within the scarred and reversed ChAR set. (I) Alluvial diagram showing shared chronic-infection related or all GWAS SNPs between HCV-specific ChARs pre-treatment and scarred and reversed ChARs post-treatment.

