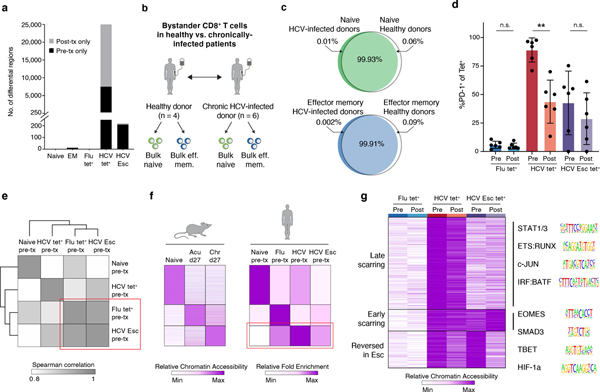
Figure 4. Chronic TCR signaling, and not inflammatory milieu, drives epigenetic scarring in exhausted CD8+ T cells.
(A) Quantification of differential ChARs within indicated conditions, before and after DAA therapy.
(B) Schematic diagram of the experiment. (C) Venn diagram of ChAR overlap in naïve T cells (top) and bulk effector memory cells (bottom) from HCV-infected donors and healthy donors. (D) PD-1 staining on tetramer populations before and after DAA therapy. Mean ± s.d., two-sided Student’s t-test with Welch’s correction; *P ≤ 0.05, **P ≤ 0.01, ***P ≤ 0.001. N = 6 donors. (E) Clustered similarity matrix between the indicated biological conditions at the pre-treatment timepoint. (F) Heatmap of peak intensity within modules of ChARs (rows) from mouse naïve CD8+ T cells, and CD8+ T cells responding to acute and chronic LCMV (left). Fold enrichment of regions orthologous to mouse naïve, memory and exhaustion enhancers in human samples indicated (right). (G) Heatmap of chromatin accessibility within scarred ChARs (rows), clustered across the indicated cell states (columns). Sequence logos for transcription factor motifs enriched within the indicated clusters (right).

