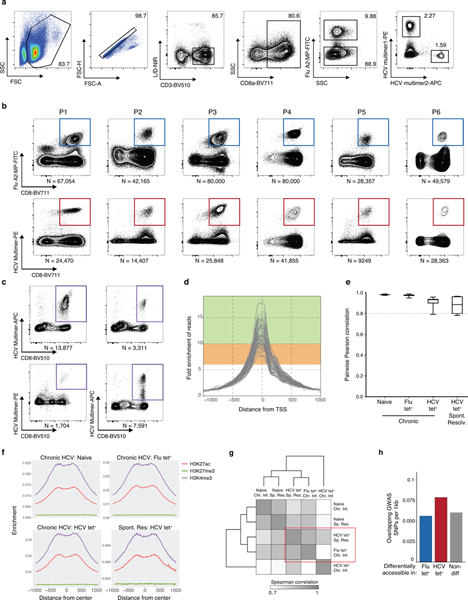
Extended Data Fig. 1.
(A) Representative flow cytometry sorting strategy for Flu and HCV multimer+ CD8+ T cells. (B) Recovered numbers of Flu (top) and HCV (bottom) multimer+ cells for each donor during chronic HCV infection. (C) Recovered numbers of HCV multimer+ cells for each donor during resolved HCV infection. (D) Combined ATAC signal across all TSSs for each biological condition from each donor. Green and range bands indicate ranges for ideal and acceptable values, respectively, for TSS enrichment per ENCODE standards. (E) Boxplots of pairwise Pearson correlations for data from individual donors within each biological condition. Centre, median; box limits, first and third percentiles; whiskers, min and max. N = 6 donors. (F) Combined ATAC signal across all H3K27ac peaks (red), H3K27me3 (green) and H3K4me3 (purple). Histone mark peaks were determined from the following samples on ENCODE: ENCFF653OGM - H3K27ac, ENCFF285FID - H3K4me3, ENCFF367HSC - H3K27me3. (G) Clustered similarity matrix between the indicated biological conditions in the chronically-infected and spontaneously resolved cohort. (H) Density of overlapping GWAS SNPs per 1000bp in Flu-specific, HCV-specific or non-differential ChARs.

