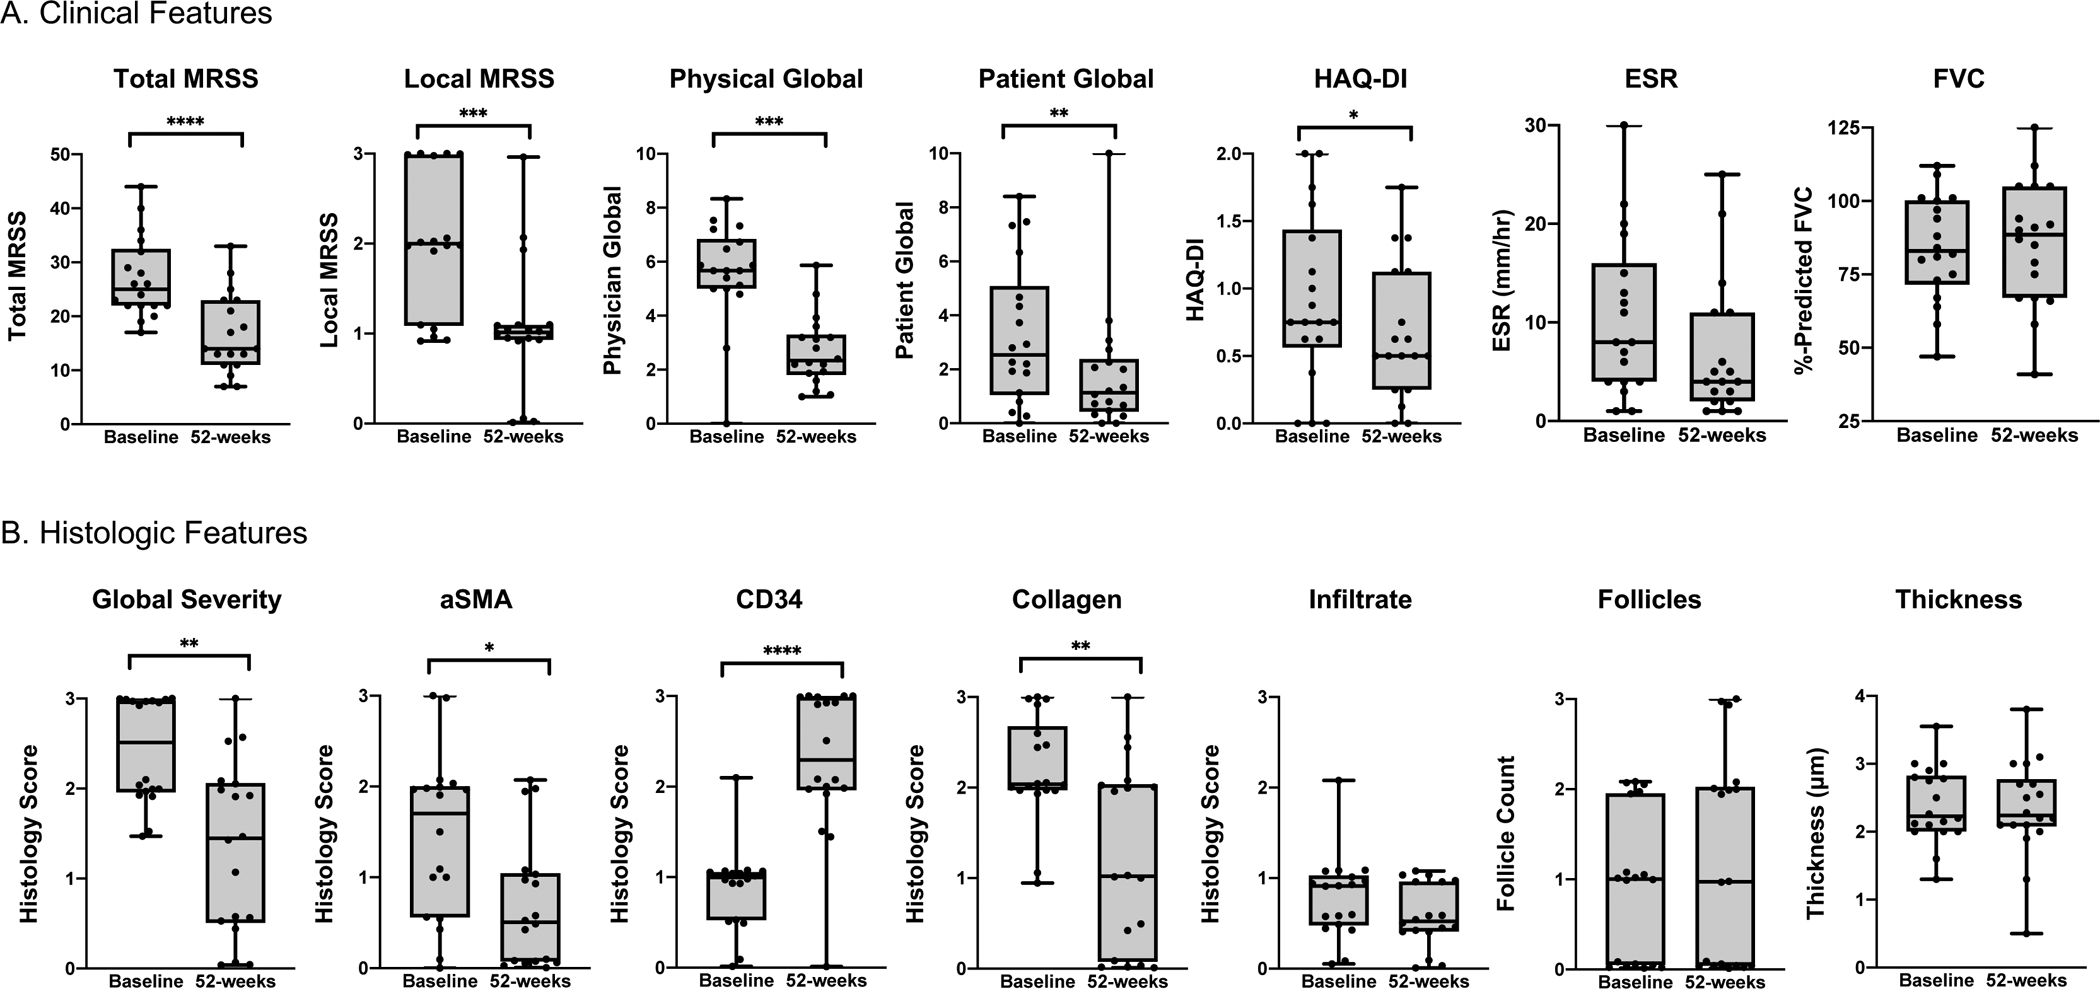
Figure 1. Clinical and histologic correlates of the Combined Response Index in Systemic Sclerosis (CRISS) ≥ 0.6 (N=18).

Among 18 individuals with diffuse cutaneous systemic sclerosis with 52-week CRISS ≥ 0.6, (A) clinical and (B) histologic changes in paired baseline and 52-week samples are demonstrated. Boxplots have whiskers from minimum to maximum values, a horizontal line at median value, and box edges at lower (Q1) and upper quartiles (Q3). P-values represent results of Wilcoxon signed-rank test. ****indicates p≤0.0001, ***p≤0.001, **p≤0.01, *p≤0.05. Adjusting for multiple comparisons, local MRSS, total MRSS, physician global assessment, patient global assessment, global histologic severity and CD34 remain statistically significant.
