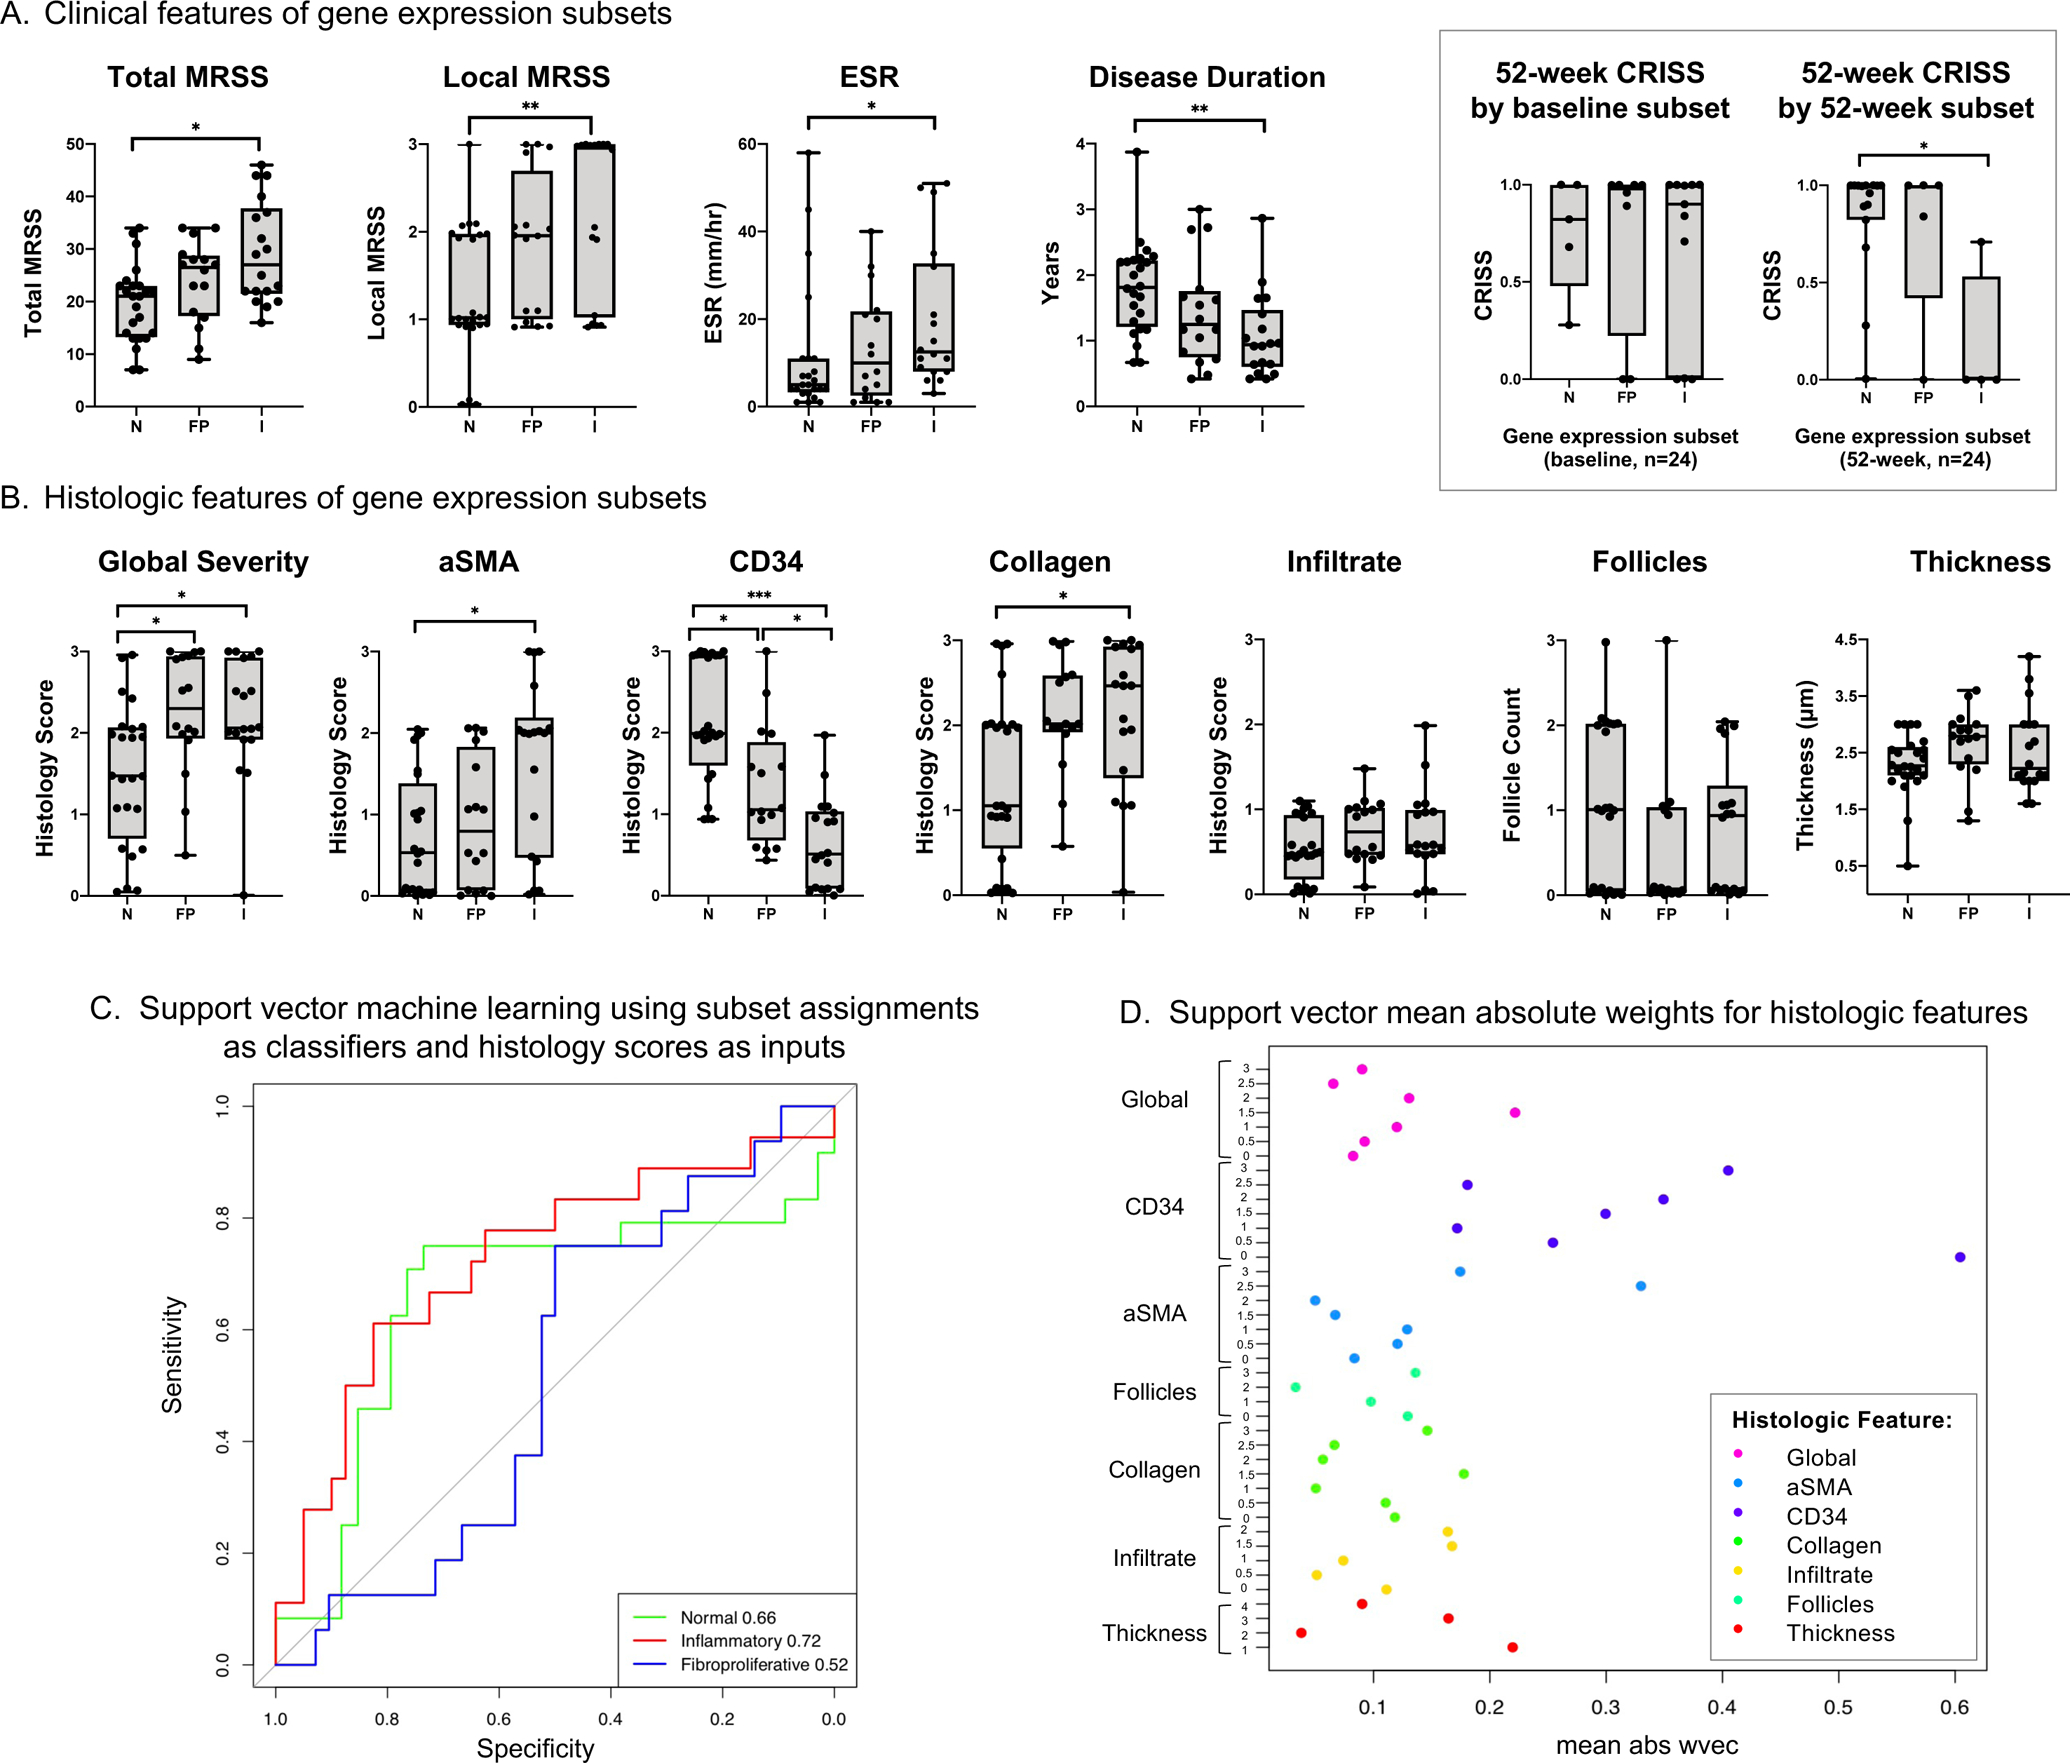
Figure 2. Clinical and histologic correlates of three gene expression subsets among 26 individuals with diffuse cutaneous systemic sclerosis.

A. Clinical features of samples assigned to each gene expression subset (N = normal-like, FP = fibroproliferative, I = inflammatory). Box displays 52-week Combined Response Index in Systemic Sclerosis (CRISS), stratified by baseline and 52-week gene expression subset for 24 individuals with paired biopsy samples. Boxplots have whiskers from minimum to maximum values, a horizontal line at median value, and box edges at lower (Q1) and upper quartiles (Q3). B. Histologic features of samples assigned to each gene expression subset. C. Support vector machine learning was performed using gene expression subset as classifiers and the seven histology feature scores (global severity, aSMA, CD34, collagen density, infiltrate, follicle count, and thickness) as inputs. For continuous variables (i.e., thickness), quantiles were generated. Area under the curve (AUC) of the receiver operating characteristic curves assessed algorithm performance and are shown in the lower right legend. The p-values for the AUC for normal-like, inflammatory, and fibroproliferative subsets are 0.02, 0.003, and 0.58, respectively. D. Support vector mean absolute weights for each binarized histology score from „w-vector‟ model identified histologic features most predictive of subset assignment. P-values represent results of Mann-Whitney U-test, adjusted for multiple comparisons using Bonferroni correction. ***indicates p≤0.001, **p≤0.01, *p≤0.05.
