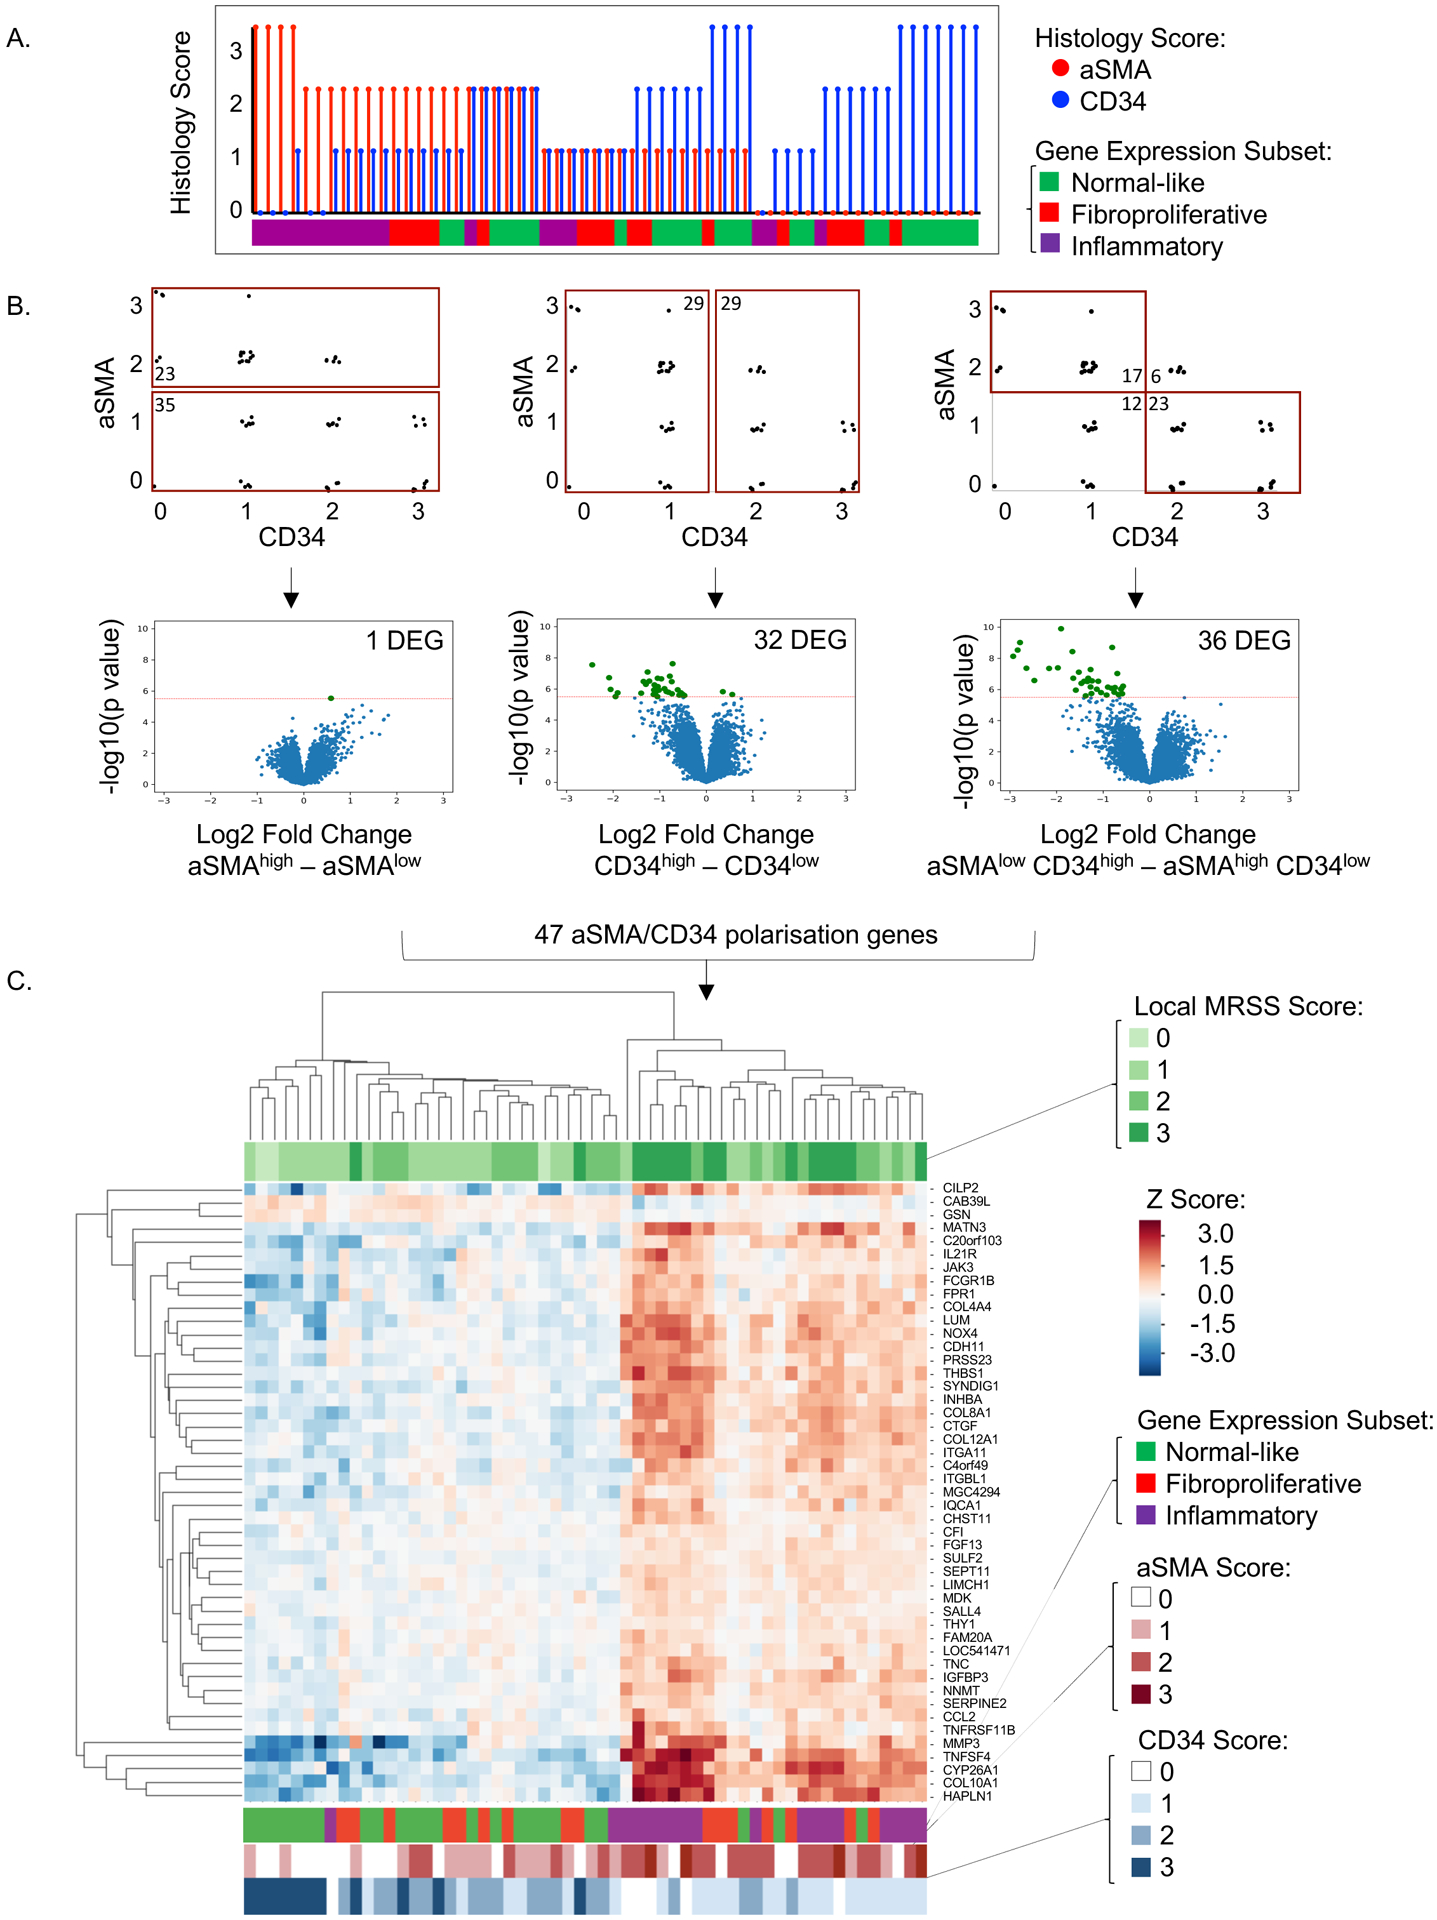
Figure 3. Gene expression according to fibroblast polarization.

A. aSMA and CD34 scores with corresponding gene expression subset assignments for N=58 samples. aSMA scores (red vertical lines) were sorted in descending order and associated CD34 scores (blue vertical lines) were visualized for each patient sample. The horizonal bar below depicts each sample‟s gene expression subset assignment. B. Upper panel: Three sample gating strategies according to aSMA and CD34 staining. aSMAhigh vs. aSMAlow (N=58 samples), CD34high vs. CD34low (N=58 samples), and aSMAlow/CD34high vs. aSMAhigh/CD34low (N=40 samples). Lower panel: Volcano plots of significantly differentially expressed genes according to aSMA and CD34 scores. Significant differentially expressed genes are highlighted in green and quantified in top right corner. The threshold for significance (horizonal red line) was 0.000003, determined using Bonferroni correction for multiple comparisons of 16645 genes evaluated. C. Unsupervised hierarchical clustering using single linkage method and Euclidean distance metric of 47 aSMA/CD34 polarization genes identified in analysis outlined in B. Top horizontal bar indicates local MRSS for each skin biopsy sample. Bottom horizontal bars indicate gene expression subset, aSMA score (red), and CD34 score (blue) for each sample.
