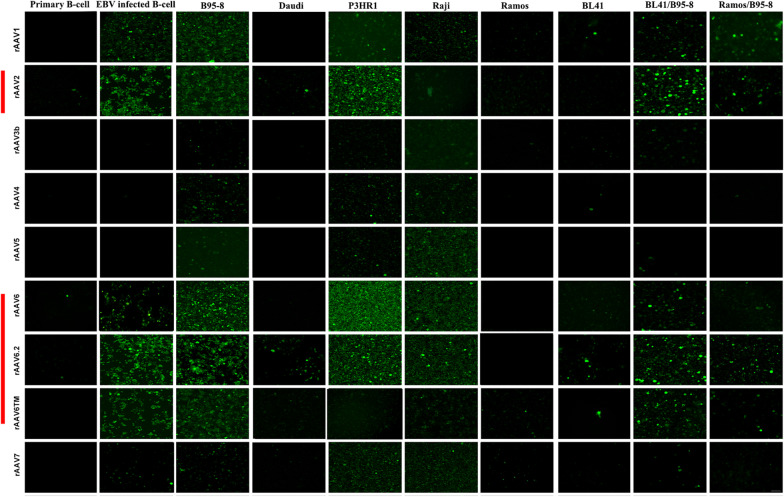
Fig. 1.
Visualization of EGFP fluorescing B-cells following rAAV transduction. Human B-cells derived from ten distinct sources (Table 2) were individually transduced with each of the fifteen rAAV serotypes encoding EGFP as displayed in Table 1. Transduction of cells was performed using standard procedures at a MOI of 105 (Methods). Fluorescent cells were visualized 48 h after transduction by confocal microscopy (Methods). The nine rAAV serotypes that produced B-cell fluorescence are displayed. The serotypes that produced the highest percentage of fluorescent cells across all B-cell sources are indicated by a vertical red line in the left margin of the figure

