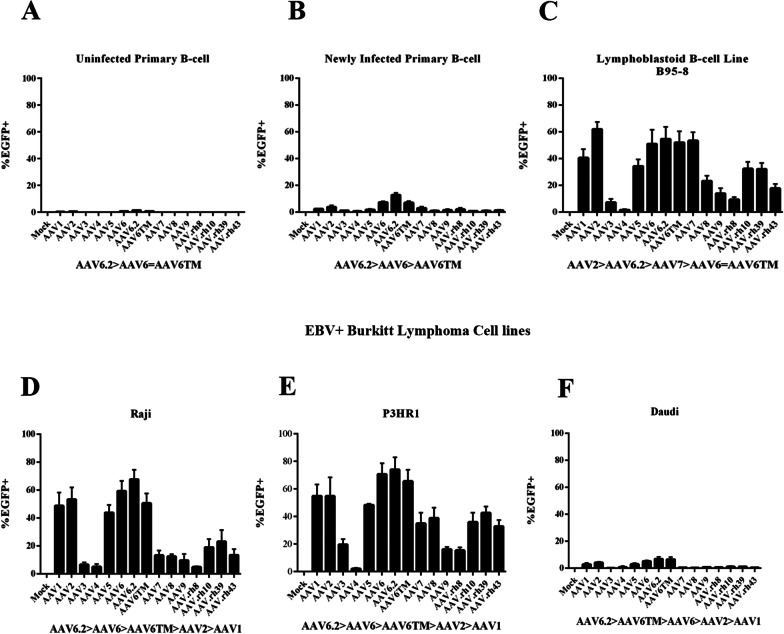
Fig. 2.
Flow cytometric analysis of EGFP fluorescing B-cells following rAAV transduction. a–c Bar graphs demonstrating the percentage of EGFP-expressing cells (y-axis) following transduction of different rAAVs (x-axis) as detected by flow cytometry in a uninfected primary B-cells, b primary B-cells 48 h after EBV infection, and c B-cells stably immortalized by the prototype EBV B95-8 virus, d–f Bar graphs demonstrate the percentage of EGFP-expressing cells (y-axis) detected in three different EBV + Burkitt lymphoma cell lines: d Raji, e P3HR1, and f Daudi as assessed by flow cytometry 48 h after transduction of different rAAV serotypes (x-axis). The EBV genomes of the respective tumor lines vary based on mutation, deletion and inversions. The bar graphs display mean ± SD, n = 3 independent experiments. A rank order of the serotypes producing the highest percentage of fluorescent cells is displayed under each histogram

