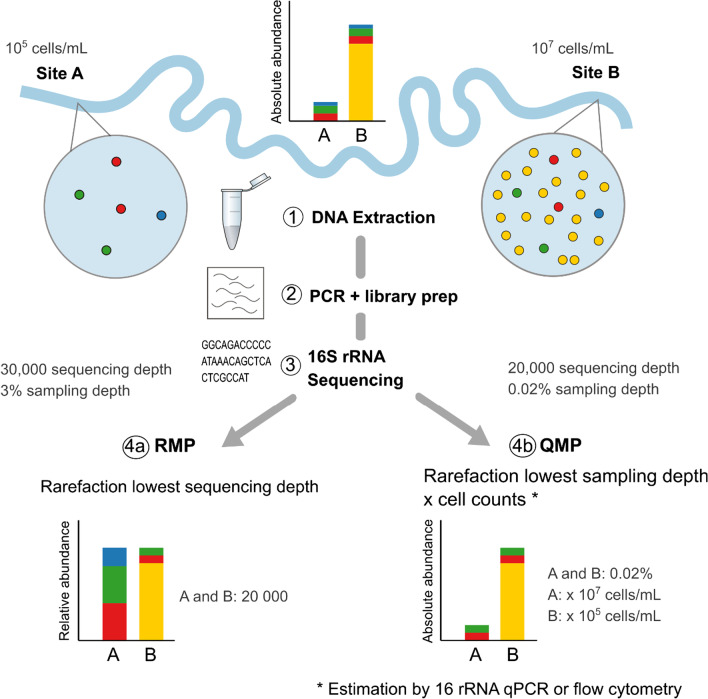
Fig. 1.
Schematic explaining relative (RMP) and quantitative (QMP) environmental microbiome profiling. Both, the RMP and QMP approach do not correct for biases introduced by sample collection, DNA extraction, PCR or library preparation. QMP approach based on [17]. While cell counts vary 100-fold between river water samples A and B, sequencing depth (= reads) per sample is independent of cell counts in next-generation sequencing. The RMP approach rarefies to lowest sequencing depth per sample, calculating relative abundance (%), which results in sample A being sequenced more intensively than sample B. The relative abundance profile poorly reflects the real environmental taxa distribution. The QMP approach corrects for sampling intensity by rarefying to the lowest sampling depth (= sequencing depth divided by cell counts) and then multiplies the rarefied taxon abundance with estimated cell counts to obtain absolute abundances (here per mL river water). As the blue taxon was equally abundant in A and B, the fact that it is included for RMP sample A can be considered an artefact of uneven sampling intensity

