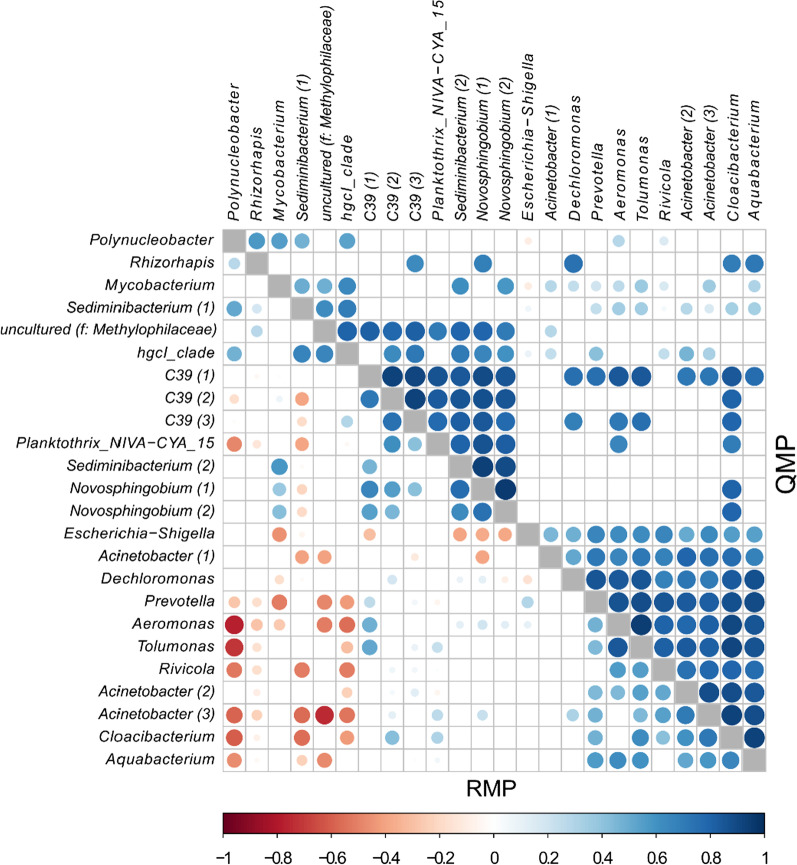
Fig. 4.
Co-occurrence patterns for ASVs detected in at least 85% of the samples based on relative (RMP) and quantitative (QMP) microbiome profiling. ASVs are labeled based on their genus name. Where different ASVs have the same genus name, numbers in parentheses differentiate those. Pairwise correlations between taxon abundances were calculated, and significant correlations (Benjamini–Hochberg adjusted test, P < 0.05) are represented by circles, the colour and size of each circle represent the correlation coefficient (Spearman’s ρ). f: family

