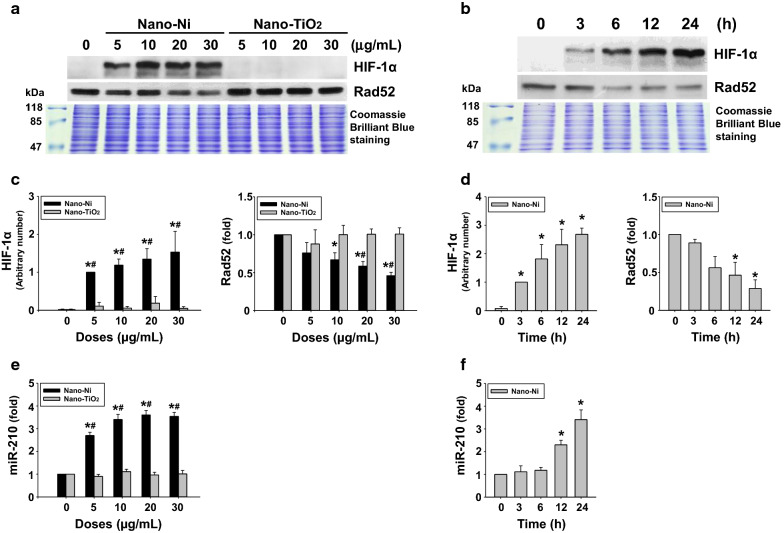
Fig. 3.
Nano-Ni up-regulated HIF-1α and miR-210 and down-regulated Rad52 in BEAS-2B cells (dose- and time-response studies). For the dose–response study, cells were treated with 5, 10, 20, and 30 µg/mL of Nano-Ni or Nano-TiO2 for 24 h. For the time-response study, cells were treated with 20 µg/mL of Nano-Ni for 3, 6, 12, and 24 h. Cells without treatment were used as the control. A, B are results of a single Western blot experiment. Nuclear protein was subjected to Western blot. Equal nuclear protein loading was verified by Coomassie Brilliant Blue staining. C, D are quantified band densitometry readings averaged from at least 3 independent experiments ± SEM of Western blot results. E, F miR-210 expression was determined by real-time PCR. Values of miR-210 expression were normalized to the endogenous control U6 snRNA. Data are shown as mean ± SEM (n = 3). * p < 0.05 vs. control; # p < 0.05 vs. same dose of Nano-TiO2-treated group

